Introduction
It was recently suggested that sprinting ability, in addition to maximal oxygen uptake and running economy, is important in long-distance running performance. For example, 100 m and 400 m sprint times were associated with 5000 m seasonal best times in national-level long-distance runners (Yamanaka et al., 2019). Paavolainen et al. (1999) suggested that the enhancement of 20 m sprinting ability through nine weeks of explosive-type strength training improved the running velocity at maximal anaerobic capacity as well as 5 km times. The reasons for the association between sprinting ability and long-distance running performance could be that runners who run fast also possess superior running economy at high speeds. Li et al. (2019) reported that training which combines heavy resistance and plyometric exercise can improve 50 m sprint times and high-speed running economy in well-trained long-distance runners. Since sprinting ability is related to stretch-shortening cycle exercise performance (Barr and Nolte, 2011; Kale et al., 2009; Schuster and Jones, 2016), distance runners who have a strong sprinting ability can efficiently convert chemical energy to kinetic energy in the muscle-tendon unit. Thus, they have superior running economy at high speeds and can perform well in long-distance running events. Therefore, sprinting ability is one of the important factors determining long-distance running performance; however, the factors which determine the sprinting ability of long-distance runners remain unclear.
Running motion is complex and consists of various joint movements. Since muscle size is closely and positively related to joint torque (Fukunaga et al., 2001) and maximum running speed is related to morphological characteristics (Čoh et al., 2010), it is important to understand lower limb muscularity in elite athletes for identifying the factors which determine the sprinting ability. For example, it has been recently demonstrated that faster sprinters had a greater volume of hamstring muscles (HM) in their thighs, but there were no associations between 100 m sprint times and volume of the quadriceps femoris (QF) or adductor (AD) muscles (Sugisaki et al., 2018). These results suggest that HM should be hypertrophied by sprinters to improve sprinting ability. Some studies involving long-distance runners have shown that resistance training of the thigh muscles is effective at improving sprinting and long-distance running performance (Blagrove et al., 2018; Denadai et al., 2017; Karsten et al., 2016; Millet et al., 2002). Thus, determining how the muscularity of long-distance runners is associated with their sprinting ability and long-distance running performance could assist the development of training regimens. However, this information remains unknown.
From a morphological point of view, previous studies have suggested that the hip extensor muscles (e.g., HM) were primarily responsible for propelling the body during sprinting (Morin et al., 2015; Nagahara et al., 2019; Sugisaki et al., 2018). For example, an association between the electromyographic activity of the biceps femoris at the end of the swing phase and the horizontal ground reaction force during sprinting has been established (Morin et al., 2015). Furthermore, greater propulsive force (mainly produced by the hip extensor muscles) has been demonstrated to be closely and positively related to acceleration during running (Nagahara et al., 2019). These observations suggest that the HM are key determiners of sprinting ability. We therefore hypothesized that HM size would be positively correlated to sprinting ability in long-distance runners, as previously shown in sprinters (Sugisaki et al., 2018). The present study examined the association between the size of the thigh muscles and the sprinting ability of national-level long-distance runners.
Methods
Participants
Nineteen Japanese male long-distance runners (age: 26 ± 3 years, body height: 172 ± 5 cm, body mass: 58 ± 4 kg) participated in this study. Participants had average official personal best times for the 5000 m and 10000 m events of 13:45.77 (range: 13:12.63–14:14.87) and 28:26.98 (range: 27:29.69–29:06.64), respectively. Before the experiment, the purpose, procedures, and risks associated with the study were explained, and written informed consent was obtained from each runner. The experimental protocols were approved by the ethics committee of the Japan Institute of Sports Sciences. This study was completed in accordance with the Declaration of Helsinki.
Magnetic resonance imaging
Participants were scanned in a supine position with a 3.0 T whole-body magnetic resonance image (MRI) scanner (MAGNETOM Verio or Skyra, Siemens Healthcare Diagnostics K.K, Tokyo, Japan). T1-weighted spin-echo transaxial images of the right thigh were collected from the greater trochanter to the distal end of the femur, using the following variables: repetition time = 500 ms, echo time = 8.2 ms, matrix = 256 × 256, field of view = 240 mm, slice thickness = 10 mm, and interslice gap = 5 mm.
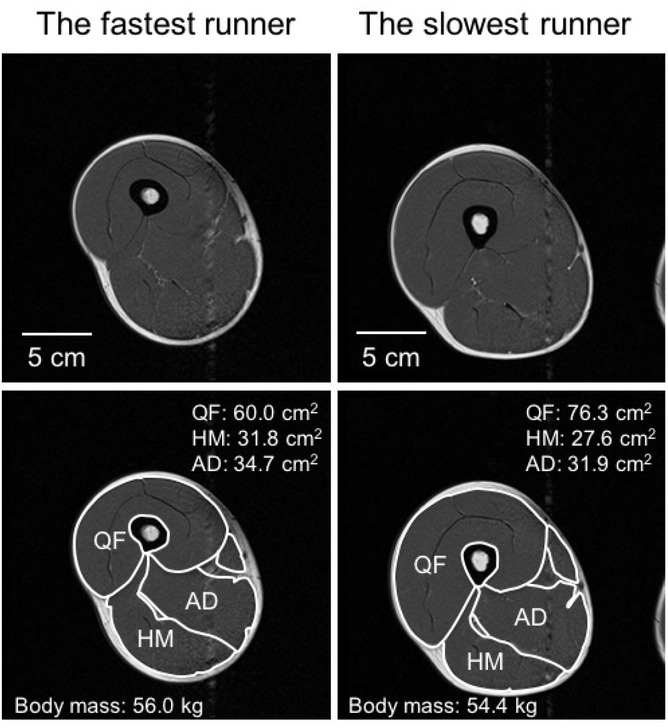
Specially designed software (Independent System for Imaging Services, Hitachi Healthcare Manufacturing, Chiba, Japan) was applied to analyze the images on a personal computer. The slice corresponding to the maximal cross-sectional area (CSA) was different among the muscle groups (i.e., QF, HM, and AD) (Akima et al., 2000; Yoshiko et al., 2017), and, to the best of our knowledge, these regional differences have not previously been examined in national-level long-distance runners using MRI. Therefore, images corresponding to 30%, 50%, and 70% of the length from the greater trochanter to the lower edge of the femur were analyzed. The QF, HM, and AD groups were identified, and the CSAs of these muscles were calculated based on the images (Figure 1). The CSA is a function of the muscle length to the second power, and the mass is a function of the length to the third power. Based on a previous study (Takahashi and Wakahara, 2019), the ratio of the muscle CSA to body mass to the two-thirds power was calculated as the relative muscle CSA (cm2/kg2/3) to account for the influence of body mass on muscle CSA.
100 m and 400 m sprint tests
The sprint tests were performed on an all-weather track using a wireless phototube system to obtain the times (Brower TCi Timing systems, HaB International Ltd., England, UK). The times were calculated between two timing gates, although a starting cue was provided by a tester. Participants wore their track spikes. After performing warm-ups individually, participants performed the 100 m sprint from the standing position twice with a 10 min rest interval between trials. The better time was used in the analyses. Participants then performed a 400 m sprint from a standing start after 10 min of rest.
Statistical analyses
Statistical analyses were performed using the IBM SPSS Statistics software (version 24.0; IBM, Tokyo, Japan). The regional differences in the CSAs were examined for each muscle group using a one-way analysis of variance (ANOVA) followed by the Bonferroni multiple-comparison test. ω2 and Cohen’s d were calculated as the indices of the effect size for the one-way ANOVA and multiple-comparison testing, respectively. The ω2 or d values were interpreted as representing trivial, small, medium, and large impacts for the cases of ω2 < 0.01 or d < 0.20, 0.01 ≤ ω2 < 0.09 or 0.20 ≤ d < 0.50, 0.09 ≤ ω2 < 0.25 or 0.50 ≤ d <0.80, and 0.25 ≤ ω2 or 0.80 ≤ d, respectively (Cohen, 1988). The relationships between the normalized CSA of each muscle, the 100 m and 400 m sprint times, and the official personal-best times for the 5000 m and 10000 m events were evaluated using Pearson’s product-moment correlation coefficients. The level of significance was set at p < 0.05 for all analyses. All data are presented as mean ± standard deviation (SD).
Results
The normalized CSAs of each muscle group at the 30%, 50%, and 70% points along the thigh length are presented in Table 1. For the QF, the effect of the region imaged (i.e., 30%, 50%, or 70%) was significant (p < 0.001, ω2 = 0.83), and the normalized CSA was greater at 50% than at 30% (p < 0.001, d = 1.86) and 70% (p < 0.001, d = 2.80) and greater at 30% than at 70% (p = 0.001, d = 1.02). For the HM, the region also significantly affected the CSA (p < 0.001, ω2 = 0.97), and the normalized CSA was greater at 50% and 70% along the thigh length, as compared with 30% (50% vs. 30%: p < 0.001, d = 10.17; 70% vs. 30%: p < 0.001, d = 10.40), with no significant difference between 50% and 70% (p = 0.092, d = 0.61). Likewise the CSA of the AD was significantly affected by the region imaged (p < 0.001, ω2 = 0.99); the normalized CSA was greater at 30% than at 50% (p < 0.001, d = 7.59) and 70% (p < 0.001, d = 12.64) and was greater at 50% than at 70% (p < 0.001, d = 5.48).
Table 1
Normalized CSA of the QF, HM, and AD muscles.
| 30% | 50% | 70% | |
|---|---|---|---|
| QF (cm2/kg2/3) | 4.1 ± 0.3 | 4.7 ± 0.3* | 3.7 ± 0.3*† |
| HM (cm2/kg2/3) | 0.5 ± 0.1 | 2.1 ± 0.2* | 2.3 ± 0.2* |
| AD (cm2/kg2/3) | 4.5 ± 0.4 | 1.9 ± 0.3* | 0.7 ± 0.2*† |
[i] Values are presented as mean ± SD. CSA: cross-sectional area; QF: quadriceps femoris; HM: hamstrings; AD: adductor muscles CSAs were calculated from the transaxial images at 30%, 50%, and 70% of the distance from the greater trochanter to the lower edge of the femur; the CSAs were normalized by body mass and power of 2/3. *:p < 0.05 vs. 30%, †: p < 0.05 vs. 50%, a one-way analysis of variance followed by a Bonferroni multiple-comparison test.
The average 100 m and 400 m sprint times were 13.44 ± 0.61 s and 56.86 ± 2.27 s, respectively.
Table 2 provides the coefficients of the correlations between the normalized CSAs of each muscle at 30%, 50%, and 70% of the thigh length, the 100 m and 400 m sprint times recorded in the experiment and official personal-best times for the 5000 m and 10000 m events. There were significant correlations between the normalized CSA of the QF at the 50% and 70% regions and the 100 m and 400 m sprint times, whereas there was no significant correlation between the CSA at 30% and the sprint times. The normalized CSA of the HM and AD at 30%, 50%, and 70% did not significantly correlate with the 100 m and 400 m sprint times. The normalized CSA of the QF at 50% and 70% was significantly correlated with the official personal-best times for the 5000 m and 10000 m events, while that at 30% was not. There were no significant correlations between the normalized CSA of the HM and AD at 30%, 50%, and 70% and long-distance performance.
Table 2
Coefficients of correlation between the CSAs and sprint times and long-distance performance.
Discussion
The present study examined the relationships between the CSAs of individual thigh muscles and sprinting performance, with the main findings being that there were positive correlations between the CSAs of the QF and the 100 m and 400 m sprint times of the national-level long-distance runners, whereas the CSAs of the HM and AD were not significantly correlated with sprint performance. These results did not support our hypothesis that HM size is positively related to sprinting ability (i.e., negatively related to sprint time). To the best of our knowledge, this is the first study to demonstrate the relationship between thigh muscularity and sprinting ability in national-level long-distance runners.
These results suggest that having larger QF muscles negatively impacts the sprinting ability of long-distance runners. Sugisaki et al. (2018) demonstrated that faster sprinters had greater muscularity in the HM relative to the QF. Based on running speed-dependent observations and considering muscle strategy (Dorn et al., 2012) and ground reaction forces (Nilsson and Thorstensson, 1989), it was speculated that the knee extension torque produced by the QF was the primary contributor to the vertical force. More recently, Nagahara et al. (2019) suggested that a smaller peak vertical force produced better sprint acceleration, and Matsuo et al. (2019) further reported that superior sprinting performance was achieved when less work was applied in the vertical direction during the braking and propulsive phases. Therefore, it is speculated that greater knee extension torque produces greater vertical force during sprinting, which negatively impacts sprinting performance. This consideration could partially explain the significant and positive correlations observed between the CSAs of the QF with the 100 m and 400 m sprint times in the present study. Therefore, having a smaller QF might be beneficial to the sprinting performance of long-distance runners.
The QF is not the primary muscle which propels the body during running. For example, Kyröläinen et al. (2005) demonstrated that the vastus lateralis, a component of the QF, was substantially activated immediately before and after ground contact during higher-speed running, whereas the HM was activated during the propulsive phase. This suggests that the QF contributes to braking the body during ground contact, whereas the HM is the primary generator of the propulsive force. Therefore, greatly hypertrophied QF muscles might not benefit well-trained runners because of the undesired excess weight.
Contrary to the results obtained in the present study, it has been demonstrated that longterm resistance training of knee extensor muscles improved the speed at the end of a long-distance race (Damasceno et al., 2015; Mikkola et al., 2011). Furthermore, some studies have shown that resistance training of the thigh muscles, including the QF, was effective at improving sprinting and long-distance running performance (Blagrove et al., 2018; Denadai et al., 2017; Karsten et al., 2016; Millet et al., 2002). Damasceno et al. (2015) suggested that an increase in maximum strength could lower the relative force generated per step length, while the step length remained unchanged. Inconsistent results between previous studies and the present one might be due to the study design (i.e., cross-sectional vs. longitudinal). However, performance levels of long-distance runners in this study are much higher than in the previous ones discussed herein. Thus, we believe that the associations found in previous studies between the size of the knee extensor muscles and sprinting performance are attributed to the performance level of participants. Therefore, national-level long-distance runners should avoid excessive resistance training of the QF to maintain or improve their sprinting performance.
We hypothesized that HM size would be positively related to sprinting ability (i.e., negatively related to sprint time); however, this was not observed in the present study. Nagahara et al. (2019) demonstrated that the mean propulsive force was closely related to acceleration during running. It has been established that an association exists between the horizontal ground reaction force during sprinting and the electromyographic activity of the biceps femoris at the end of the swing phase (Morin et al., 2015). Therefore, negative associations between the CSA of the HM and the 100 m and 400 m sprint times were expected. Sugisaki et al. (2018) reported a negative correlation between HM muscle volume and 100 m sprint times. Ema et al. (2018) further reported that HM muscle volume was greater in sprinters than in untrained individuals. The main reason for the divergence in results between previous studies and the present one is most likely due to the differences between sprinters and long-distance runners. In general, sprinters run faster than long-distance runners, i.e., 10.23–11.71 s for the 100 m sprint in a previous study (Sugisaki et al., 2018) versus 12.41– 14.34 s achieved by long-distance runners in the present study. An increase in running speed increases hip extension torque (Schache et al., 2011); therefore, the hip extensor muscles (e.g., HM) of sprinters are usually hypertrophied, which could explain why there is a significant association between HM size and 100 m sprint time in sprinters, but not long-distance runners.
These results could be helpful to long-distance runners and their coaches when considering running motion or other training interventions. It is suggested that runners with lower sprinting ability produce greater vertical force relative to propulsive force during the acceleration phase and, thus, cannot run as fast. Kawamori et al. (2014) demonstrated that applying weighted sled towing as a training technique decreased the vertical force generated by runners and improved their sprinting capabilities. Furthermore, cycling with a high load/intensity has been shown to activate the hip extensor muscles considerably (Ando et al., 2019), which contributes to the production of propulsive force during running, and it has been demonstrated that bicycle sprint training improved the metabolism of lactate by runners (Oriishi et al., 2018). Therefore, strength or sprint training which avoids increased vertical force relative to propulsive force will benefit long-distance runners who have greater QF CSAs and inferior sprinting performance.
In conclusion, this study found that long-distance runners who had a smaller QF CSA sprint faster, and the CSAs of their HM and AD were not significantly related to sprinting ability. We suggest that having a greater QF CSA negatively impacts sprint performance because the knee extension torque produces a greater force in the vertical direction relative to propulsive force during running. Therefore, national-level long-distance runners should avoid running motions which activate the QF much more than the HM and AD.