Introduction
Coaches are always looking to evaluate athletes’ fitness to determine goals, training plans, select talents, and identify their strengths and weaknesses. Laboratory and field testing can be used to evaluate fitness components and performance in athlete populations (Mendel and Cheatham, 2008). Laboratory tests are highly valid, but not always available in sporting settings because of the need for expensive equipment and expertise. In contrast, field tests, which do not require expensive tools and are more easy to apply, have attracted the attention of coaches (Mendel and Cheatham, 2008). Thus, validated field tests incorporating a sport-specific movement pattern are valuable. However, it is difficult to evaluate physical fitness in skill based sports such as futsal because both skill and fitness affect each other. Therefore, the design of futsal-specific tests is of particular importance.
In other words, futsal is a high-intensity, intermittent team sport in which players perform repeated sprints and agile movements (Barbero-Alvarez et al., 2008). It has been reported that futsal players change activities every 2–3s, and perform high-intensity bouts every 43s and maximum-intensity efforts every 56s. Moreover, the work-to-rest ratio is 1:1, with approximately half the work performed at high intensities (Naser et al., 2017). Research has shown that players spend more than 83% of actual playing time at intensities higher than 85% of the maximum heart rate (HRmax) (Barbero-Alvarez et al., 2008). Furthermore, mean blood-lactate concentrations may reach levels above 5 (range: 3.5–11) mmol·l-1 (Castagna et al., 2009). This pattern of activities and futsal-specific demands indicates the essential involvement of the anaerobic metabolism in the energy supply (Alvarez et al., 2009; Castagna et al., 2009). It, therefore, is essential to measure the anaerobic fitness components in competitive futsal players.
There are numerous laboratory and field methods for evaluating anaerobic fitness. The 30-s Wingate anaerobic test (WAnT) is the most valid and the gold standard for assessing anaerobic power (Bar-Or, 1987; Krishnan et al., 2017). The test provides useful information on average power (AP), peak power (PP), and the fatigue index (FI). However, disadvantages of the WAnT include the need for expensive equipment such as an ergocycle (Monark), software, and a laptop, and performing the test is also time-consuming. Moreover, as the test is performed on a bike, this may reduce transferability to intermittent team sports such as futsal. Indeed, the WAnT may not be the best tool for measuring performance in a sport requiring repeated sprints (Keir et al., 2013). Consequently, simple and low-cost field tests that are highly reliable, sport-specific, and practicable can be an alternative to Wingate testing.
The running-based anaerobic sprint test (RAST) is a simple, low-cost, and practicable test comprising six 35-m sprints with 10s of rest in between. High validity for evaluating anaerobic metabolism has been reported for the RAST (Andrade et al., 2015; Bongers et al., 2015; Zagatto et al., 2009). Bongers et al. (2015) reported high correlation coefficients between RAST and WAnT performance (r=0.9 for AP). In contrast, Queiroga et al. (2013) reported that the settlement of analysis between the WAnT and the RAST was low. The authors concluded that the RAST was not an appropriate tool for evaluating performance of anaerobic power by the WAnT in cycling athletes (Queiroga et al., 2013). Specificity, activity patterns, and muscle involvement should therefore be considered when selecting a test for a specific sport. Besides, one of the disadvantages of the RAST is that it is based directly on sprint-running, in contrast to the repeated break-sprints with a change of direction that occurs in futsal (Castagna et al., 2009; Naser et al., 2017).
In this regard, the repeated curve sprint test (RCST), which requires players to complete seven 30-m curve sprints, with a change of direction in the middle, separated by 25s of recovery (Bangsbo and Mohr, 2012), has greater similarity to the activity pattern in futsal. In futsal, most of the actions performed are curvilinear and break running (Barbero-Alvarez et al., 2008; Naser et al., 2017). To the best of our knowledge, no research has been conducted to evaluate the validity of the RCST and associations between the RCST and the WAnT. However, it has been shown that the RCST is highly reliable and that curvilinear and linear sprints are independent actions (Filter et al., 2019). Because of the cost-effectiveness and easy application of the RCST and the RAST, they can be used to assess the capacity of the legs to generate anaerobic power in futsal players.
However, no studies to date have investigated the correlation between the RCST and other field (RAST) and laboratory (WAnT) tests used in competitive futsal. Thus, the present study aimed to investigate whether there was a correlation between the RCST and the WAnT, and between the RCST and the RAST, in trained futsal players to test the hypothesis that the RCST is a valid and relevant anaerobic test in futsal.
Methods
Participants
Male players competing in the local futsal league in Iran were recruited. The inclusion criteria were: playing 3-5 years in the provincial league, practicing at least 5 times per week, and good physical health status without any injuries or muscle soreness. Fifteen players (age 20.7±2.5 yrs; body mass 66.4±7.4kg; body height 177.3±6.4cm; body fat content 12.1±3.9%; body mass index (BMI) 21.1±1.1kg·m-2) met the inclusion criteria and voluntarily participated in the study. Players who sustained injuries during evaluations and did not participate in all tests were excluded. In the beginning, all participants and parents were informed of the benefits and possible risks of the study and signed a written informed consent form during the familiarization session. During this session, they also completed the general health and sports history questionnaires. This research was conducted in accordance with the Declaration of Helsinki and approved by the ethics committees of the Razi University.
Procedures
One week before the intervention, participants attended the Razi University’s lab and were instructed how to perform the tests (all participants were familiarised with all tests before the experimental procedures) and informed regarding the research schedule. During this session, body height and mass were measured by a standard stadiometer (Seca 213, Germany) and a calibrated digital scale (Seca 769, Japan), respectively. The BMI was calculated by dividing body mass by the square of body height. Body fat content (BF%) was assessed by taking 7-site skinfold measurements. The forchest, abdominal, thigh, triceps, subscapular, suprailiac and midaxillary skinfolds were measured (mm) by a caliper (JAMAR, USA), and then BF% was calculated by the formula of Jackson and Pollock (1978).
BF%=495/(1.112-(0.00043499×X)+(0.00000055×X2)-(0.00028826×Y))-450
where X is the sum of 7-site skinfolds (mm) and Y is the age (years).
The study used a crossover design in which the 15 participants were divided equally into three groups (A, B, C), and each group performed one test per week. For example, group A performed the Wingate test while group B performed the RAST, and group C performed the RCST. In subsequent weeks, the groups performed a different test each time so that all participants completed all three tests. The tests were executed with a one-week interval at a specific time of day for each individual. Participants were instructed not to consume coffee, caffeine, alcohol, and ergogenic substances for 48h before each test. A standardized 10-min warm-up incorporating jogging and stretching exercises was performed before each test. During the test, players were verbally encouraged to perform to their maximum ability. The tests were conducted in a room with average temperature of 23ºC and average relative humidity of 55%.
Wingate anaerobic test (WAnT)
Anaerobic indexes were measured by the WAnT on a Monark cycle (Model 894E, Monark, Sweden). The height of the seat was adjusted to the player’s leg length such that when the pedal was at the bottom, the knee angle was 170° to 175°. The workload was set equivalent to 7.5% of the individual participant’s body mass. During the test, the participant sat down on the saddle while their feet were strapped in. Following a warm-up (4 min of cycling), players pedalled as fast as they could. Afterwards the load was applied and participant pedalled with maximum effort for 30 s while remaining seated according to previous instructions (Bar-Or, 1987).
Running-based anaerobic sprint test (RAST)
The RAST was designed to evaluate an athlete’s anaerobic performance in the field, and its validity and reliability have been established (Andrade et al., 2015). The test requires participants to undertake six 35-m sprints with 10s of recovery between each sprint. Time is recorded by a photocell positioned at the start/finish lines. The power output for six sprints is calculated using the following formula (1):
power=(body mass×distance2)/time3(equation 1)
From the six calculated power outputs, PP is the highest value, AP is the sum of all values divided by six, and MP is the minimum value. The fatigue index (FI) was calculated using equation 2 (Godwin et al., 2017):
Repeated curve sprint test (RCST)
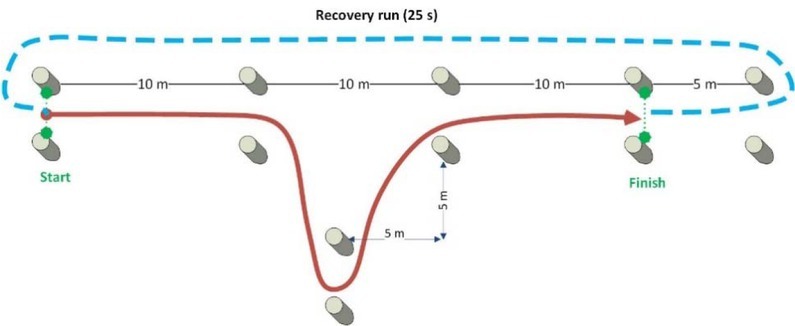
The RCST consisted of seven curve sprints with 25 s of recovery between each sprint. The path of the curve sprint is shown in Figure 1 (Bangsbo and Mohr, 2012). Time was recorded by photocells positioned at the start and finish lines. Power output and the FI for the seven sprints were calculated using equation 1 and equation 2, respectively. From the seven calculated power outputs, PP was the highest value and AP was the sum of all values divided by seven.
Blood lactate
Capillary blood samples were obtained from the fingertip and analysed for lactate by a lactometer (Lactate Scout+, Cosmos Sirius, Germany). Blood samples were taken twice in each testing regime; at baseline, before the warm-up and 5-min after each test (Amani-Shalamzari et al., 2020).
Heart rate
The heart rate was measured during all tests. Pacemaker (FT1, Polar, Finland) was fastened around the chest, and the data transmitted to the wrist receiver and downloaded to a computer.
Statistical analyses
Statistical Package of Social Sciences (SPSS, IBM, v22) software was used to analyse the data. Data are presented as mean ± standard deviation (SD). To determine the magnitude and direction of the linear relationship between particular variables, bivariate Pearson’s correlation coefficient (r), regression and paired t-tests were calculated and applied. Significance level of the correlations was set at p<0.05.
Results
Table 1 presents the mean (SD) of anaerobic indices and physiological variables following the Want, RAST and RCST. In respect of AP, there was a significant positive correlation between the RCST and the WAnT (t=26.83, p=0.001; r=0.63, p=0.012) and between the RCST and the RAST (t=16.02, p=0.001; r=0.67, p=0.006) (Figure 2). In respect of PP, there was also a significant correlation between the RCST and the RAST (t=20.43, p=0.001; r=0.71, p=0.003), but not between the RCST and the WAnT (t=19.77, p=0.001; r=0.26, p=0.354). In addition, although the results of the paired t-test showed a significant relationship between the mean FI values of the RCST and the RAST (t=2.27, p=0.040) and the RCST and the WAnT (t=14.69, p=0.001), FI values calculated in the RCST did not correlate with those calculated in either the RAST (r=-0.44, p=0.100) or the WAnT (r=-0.09, p=0.744) (Figure 2).
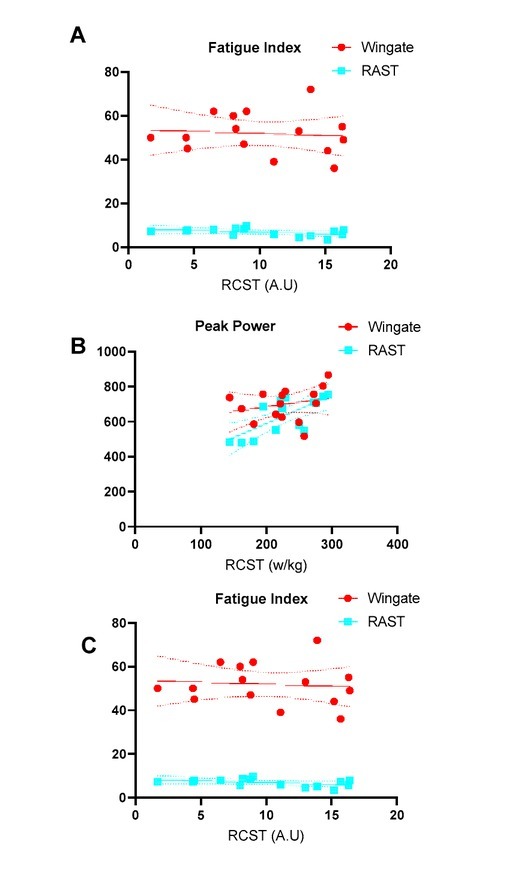
Table 1
Mean (SD) of selected variables.
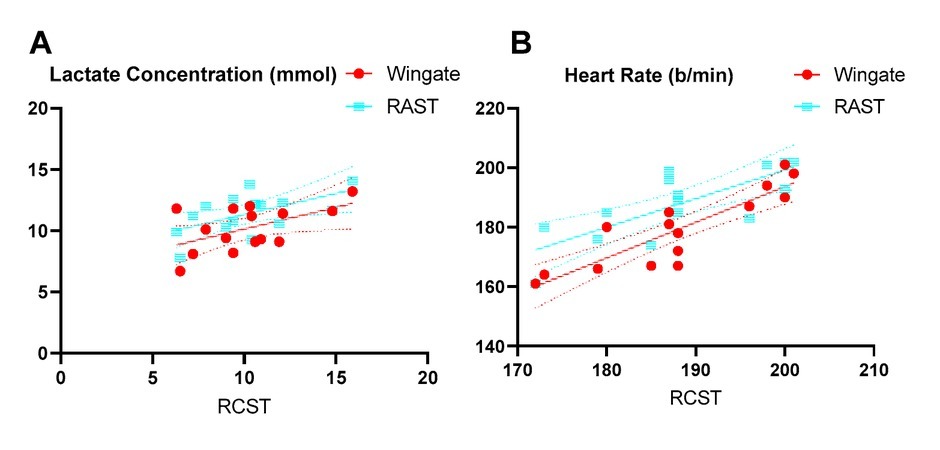
The results of the paired sample t-test showed that there was a significant relationship between post-RCST heart rates and the WAnT (t=5.19, p=0.001), but not the RAST (t=0.17, p=0.867). However, post-RCST peak heart rates significantly correlated with those for the RAST (r=0.77, p=0.001) and the WAnT (r=0.88 p=0.001). In addition, there was a significant positive relationship between post-RCST blood-lactate concentrations and those for the WAnT (r=0.54, p=0.039) and the RAST (r=0.58, p=0.025) (Figure 3). However, the paired sample t-test indicated no significant releationship between the RCST (t=2.07, p=0.058) and RAST as well as the WAnT (t=04, p=0.966).
Discussion
This study examined associations between the repeated curve speed test (RCST) and the laboratory-based Wingate anaerobic test (WAnT) and the running-based anaerobic sprint test (RAST), to determine the applicability of this field test as an alternative for evaluating anaerobic power in futsal players. The results demonstrated that there was a high inter-individual relationship between physiological variables in the RCST with both the WAnT and the RAST. Specifically, in respect of AP there were meaningful correlations between the RCST and the WAnT, and between the RCST and the RAST, though in respect of PP the correlations were not consistent. The FI values in the RCST did not correlate with those for the other two tests. The RCST therefore seems to be a valid test for measuring mean anaerobic power output in young male futsal players, but it may differ in specificity.
Previous findings show a significant relationship between the WAnT and the RAST in anaerobic variables such as PP (r=046) and AP (r=0.53) (Zagatto et al., 2009). Moreover, Bongers et al. (2015) reported a high correlation for AP during these two tests (r=0.90). It seems that these meaningful associations can be attributed to the approximately identical time and intensity of the two tests, which results in the involvement of similar energy systems (Bongers et al., 2015). For AP, our results showed a significant correlation between all three tests. Thus, the RCST appears to be a fairly valid test for measuring average anaerobic power output during a repeated sprint scenario with a change of direction.
In all tests, the load imposed on players increases towards the end of testing, as shown by physiological load data such as the heart rate. The anaerobic system is predominant in providing energy during the RAST (Milioni et al., 2017) and the WAnT (Smith and Hill, 1991), although no research has been conducted on energy supply during the RCST. Towards the end of testing in the last 5 s of the WAnT and in the final repetitions of the two field tests (RAST and RCST) the aerobic system is likely to become the predominant energy contributor (Gaitanos et al., 1993; Milioni et al., 2017; Smith and Hill, 1991). For example, Gaitanos et al. (1993) examined energy production during 10x6-s maximal sprints with 30-s of recovery in between on a cycle ergometer. Biopsy samples taken from the vastus lateralis muscle before and after the first and last sprints, showed a considerable reduction in the contribution of the anaerobic metabolism and increased aerobic energy turnover during the final sprint (Gaitanos et al., 1993). The high correlation between the RAST and the RCST could be attributed to the comparable activity pattern and intermittent nature. The RCST can, therefore, be a valid test for measuring anaerobic power in a field setting in futsal.
Although there was a correlation between the RCST and the RAST in respect of PP, no equivalent correlation was observed in the WAnT. The lack of relationship between the WAnT and the RCST could be attributed to the differences in the locomotion mode and muscle recruitment. The activity pattern in the WAnT comprises rotational velocity and progressive intensity over 30 s, whereas the RCST comprises linear velocity with acceleration and deceleration and interval activity with increased and decreased intensity. The same activity pattern could justify the observed significant correlation between the RCST and the RAST in respect of PP. Thus, the different movement patterns and active muscle mass may partly explain these findings.
The results showed no correlation between the FI values obtained in the RCST with those obtained in the RAST and the WAnT. Fatigue is a multifactorial phenomenon, and the type of exercise (intensity, duration, interval and continuous exercise, muscle mass involved) determines fatigue kinetics (Baker et al., 1993; Klapcinska et al., 2001; Liu et al., 2002). The differences in the calculation of FI values and the fatigue source of these tests may be a factor in these results (Klapcinska et al., 2001). The FI in the WAnT was obtained as the difference between power in the first and last 5-s during 30-s of continuous effort without recovery, while in the RCST and the RAST, the FI was obtained as the difference between the best and worst power values during intermitent efforts separated by 10 s of recovery between repetitions. The rest interval between repetitions in the RAST and the RCST results in a fact that a rapid loss of power does not occur. In contrast, the lack of a rest interval in the 30-s all-out effort leads to an increase in the difference between PP and AP, resulting in a higher FI in the WAnT. This is supported by Baker et al. (1993) who found a weak relationship between the FI during shuttle running and the WAnT. They stated that, due to the short breaks throughout the shuttles, the FI in the shuttle test was lower than in the WAnT. Also, the source of fatigue in continuous and interval efforts is likely to be different (Liu et al., 2002). Higher blood-lactate levels in the WAnT indicate a high glycolytic rate, which may induce acidosis in active myocytes, possibly contributing to fatigue development. In both field tests (RCST and RAST), blood-lactate levels are above the aerobic threshold, but significantly lower than in the WAnT. Moreover, studies have shown that blood-lactate concentrations overestimate muscle lactate levels during intense intermittent exercise
(Krustrup et al., 2006), and the aerobic energy component is likely to be higher in the repeated sprint tests and the Wingate test (Krustrup et al., 2006; Smith and Hill, 1991). Thus, the rest interval between repetitions is an opportunity for the cardiovascular system to supply oxygen for regenerating energy in working muscles (Gaitanos et al., 1993); moreover, the aerobic system could be a remarkable factor at the end of the test, and it would be involved in modifying lactate production. In a study by Mohr et al. (2007), the physiological responses of two different intense exercises were compared (repeated 6-s sprints and 30-s near-maximal runs corresponding to 130% of VO2max). Both exercise protocols resulted in a significant increase in the HR, greater accumulation of muscle lactate and a decrease in muscle pH, though markedly more pronounced in the 30-s group (Mohr et al., 2007), which is likely to be the same difference between the Wingate and repeated sprint tests seen in the present study. Collectively, the repeated sprint tests may reflect to a higher degree the physiological demands and fatiguing mechanisms of a futsal game. Furthermore, the RCST may to a higher degree than the RAST, mimic the movement pattern in futsal with the incorporation of the directional change.
We acknowledge that there are several limitations of this study. Firstly, the sample size was relatively small, although with the crossover-design the 15 participants executed three interventions in random order, which is a strength. Secondly, pre-test nutrition may have affected the results. Participants were asked not to ingest any ergogenic substances and to consume their normal diet and not to ingest food for at least 3–4 hours before the tests, but this was not controlled. Lastly, the psychological state may also have had an impact on the test results which could not be controlled by the researcher. However, all participants were encouraged to do their best and the tests were performed under conditions as standardised as possible.