Introduction
One of the most frequent problems in Paralympic sport is pain (Gaweł and Zwierzchowska, 2021). To train and compete at an elite level avoidance and optimal management of musculoskeletal pain is essential for each athlete. Currently available studies indicate that sport specific training contribute to adaptations in the body built and posture (Grabara, 2014, 2015; Zaina et al., 2015). Because of high training loads and repeatability of sport-specific movements athletes tend to develop muscular imbalance and spinal curvature deviations (Ahmadi et al., 2020; Grabara, 2015), that might cause musculoskeletal pain and increase the risk of injuries or traumas, what affects the athlete’s quality of life both during the competitive period and after their sports careers (Gaweł and Zwierzchowska, 2021; Zwierzchowska et al., 2017, 2020a).
The human body will always aim to maintain balance, thus it will use compensatory mechanisms, even if they are not necessarily beneficial (Tuz et al., 2021). According to Gaweł and Zwierzchowska (2021) two mechanisms are significant i.e., external and internal. External compensatory mechanisms are known as body’s adaptation to sport specific movements (Gaweł and Zwierzchowska, 2021), whereas internal compensatory mechanisms are defined as self-activating changes in the musculoskeletal system which are interdependent mostly with biomechanical factors, muscular strength and body composition (Brandt and Huang, 2019; Elsayed et al., 2018; Gaweł and Zwierzchowska, 2021; Hendershot and Nussbaum, 2013). The aforementioned mechanisms are essential to keep the sagittal balance of the spine, however, simultaneously they disturb intrinsic body biom-echanics (Xia et al., 2021).
As reported by Hendershot and Nussbaum (2013) and Brandt and Huang (2019), within different types of motor disabilities, lower limb amputations seem to be the impairment that significantly impacts human biomechanics. Furthermore, Zwierzchowska et al. (2020) found a relationship between the level and distribution of fat mass and spinal curvature deviations. As it was found, an inappropriate level of body fat mass (estimated by the body adiposity index (BAI)) has a negative influence on anteroposterior spinal curvatures, mainly by deepening the lumbar lordosis which contributes to low back pain (LBP) (Zwierzchowska and Tuz, 2018; Zwierzchowska et al., 2020b). To assess the level of fat mass, the body mass index (BMI) is usually used, however, it has been shown that the BAI is a more reliable marker, especially for people with disabilities (Zwierzchowska et al., 2013, 2020b, 2021).
According to Elsayed et al. (2018) muscular strength contributes to sagittal spine balance. Therefore, as para-athletes cannot impact their genetic predispositions (Suchomel et al., 2016) and physiological limits, the level of muscular strength may be a crucial factor impacting physiological adaptations and activations of compensatory mechanisms, especially internal ones. It can be easily assesed by the one repetition maximum (1RM) test, which is considered the gold standard for evaluating muscle strength under non-laboratory conditions. It is accepted as the maximal weight which can be lifted in a single motion with use of an appropriate technique (Wilk et al., 2020).
Because of the high prevalence of musculoskeletal pain in para-athletes, there are several theories and hypotheses concerning the factors that may contribute to pain, nevertheless, this issue is still unsolved. Thus, it seems justified to indicate fat mass and muscular strength as factors that may impact the prevalence of musculoskeletal pain and spinal curvature adaptations in para-athletes.
Therefore, the purpose of this study was to evaluate the impact of (1) maximal muscular strength of the upper body and (2) fat mass on the prevalence and location of musculoskeletal pain and sagittal spinal curvature deviations in elite Polish sitting volleyball players. We hypothesized that (1) maximal strength of the upper body and body fat mass impacted anteroposterior spinal curvatures, (2) the prevalence of musculoskeletal pain influenced the 1RM in the bench press, (3) pain in the upper limbs was associated with the level of visceral fat mass.
Methods
Participants
The study included twelve elite sitting volleyball players from the Polish national team. The inclusion criteria were (a) at least minimal disability (MD) according to the Word ParaVolley classification, (b) no neuromuscular or musculoskeletal disorders, and (c) minimum two-year experience in strength training. Table 1 provides a detailed description of participants.
Table 1
Specific characteristics of the sitting volleyball players.
Calculating the BMI requires the use of accurate internal variables of the body segments (Durkin and Dowling, 2003). Because of limb deficiency reported in the majority of participants, a standard BMI formula (Zwierzchowska et al., 2014) could not be used, and therefore, the calculations were made based on the Browni-Fisher rate (Bober and Zawadzki, 2003) and the body adiposity index (BAI) which was calculated using the formula: (BAI = hip circumference [cm]/(body height [m])1.5) –18) The proportion of total body weight assigned to different body segments was as follows: hand (1%), forearm (2%), arm (3%), head (7%), trunk (43%), thigh (12%), shank (5%), and foot (2%) (Bober and Zawadzki, 2003).
The amputee group used prostheses (n = 5) or orthopedic crutches (n = 1) in the activities of daily living and locomotion. Only one athlete had a bilateral amputation above the knees and used a wheelchair in everyday life. The athletes from the Les Autres group used prostheses (n = 2), orthopedic crutches (n = 1) and no supportive equipment (n = 2).
The measurements were carried out during a five-day national team training camp at the Academy of Physical Education in Katowice, Poland. Participants were informed about the advantages and disadvantages of the study and provided written informed consent. The research protocol was approved by the Bioethics Committee for Scientific Research at the Academy of Physical Education in Katowice, Poland (No. 9/2012) and met the ethical standards of the Declaration of Helsinki, 2013. Moreover, participants were allowed to withdraw from the experiment at any moment. Furthermore, they were instructed not to perform resistance exercises within 72 hours of testing as well as to maintain their normal dietary and sleeping habits for 24 hours before the study.
Measurements
A direct-participatory systematic observation method was used in the study. Athletes arrived at the laboratory in the morning (8 – 11 a.m.). To assess the current prevalence and location of musculoskeletal pain the Nordic Musculoskeletal Questionnaire from the last seven days (NMQ = 7) (Kuorinka et al., 1987) was employed. It included nine following body parts: the neck, shoulders, the upper back, elbows, wrists, the lower back, hips/thighs, knees, and ankles/feet. Before completing the questionnaire, athletes were instructed not to report phantom pain because of psychological factors that frequently contribute to this phenomenon (Fuchs et al., 2018). Next, anthropometric and spinal curvature measurements were taken and then maximal strength assessment was performed.
Anthropometric measurements
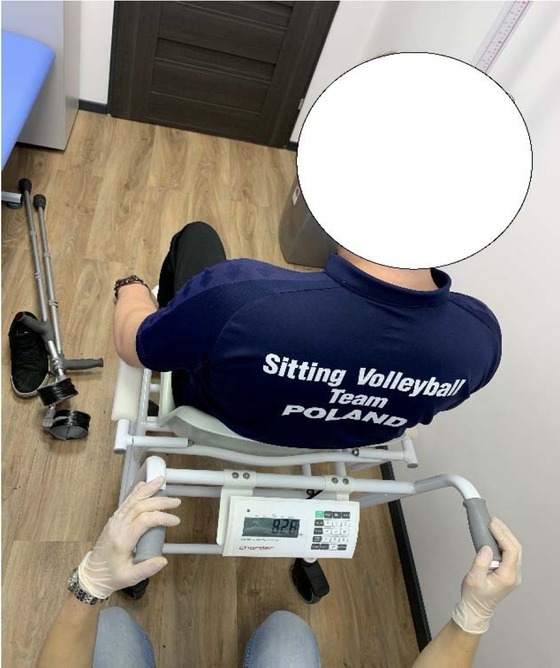
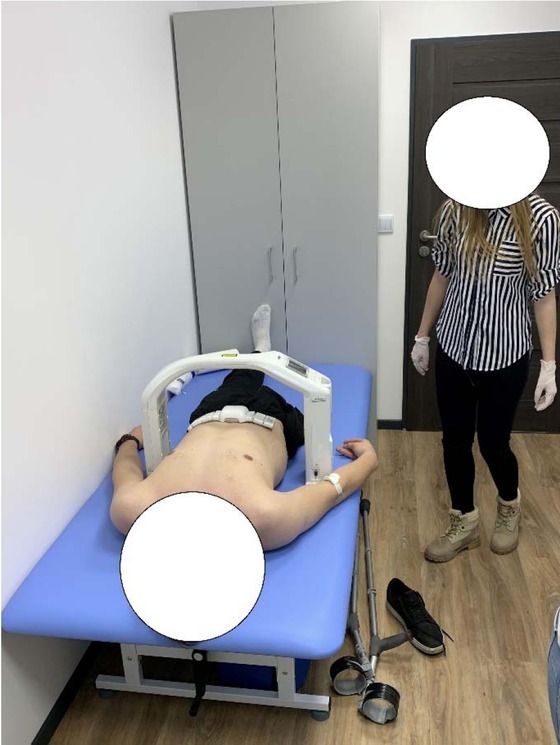
Body height (BH) was measured with a wall-mounted stadiometer with a centimeter scale, including the wheelchair user who was able to stand on amputation stumps. A chair weight (Figure 1) was used to evaluate body mass (BM). The circumferences of hips (HC) and waist (WC) were measured with the use of an anthropometric tape on bare skin, in a lying position and according to the recommended anthropometric techniques, i.e., HC – around the greatest convexity of the gluteal muscles below the iliac ala, WC – at the midpoint between the superior iliac crest and the lowest rib (Zwierzchowska et al., 2014). The assessment of fat mass was performed with a Tanita Viscan AB-140 Abdominal Fat Analyzer (Figure 2) which is known to be a golden standard for individuals who cannot stand in the upright position and has 95% sensitivity and reliability (Zwierzchowska et al., 2014).
Spinal curvature measurements
To evaluate spinal curvatures a noninvasive method Medi Mouse (Idiag M360) was used (Figure 3). Before the examinations, all procedures were demonstrated and explained by the same two specialists who performed the measurements. It should be mentioned that the Medi Mouse ensures reproducibility even if two different researchers conduct the examinations.
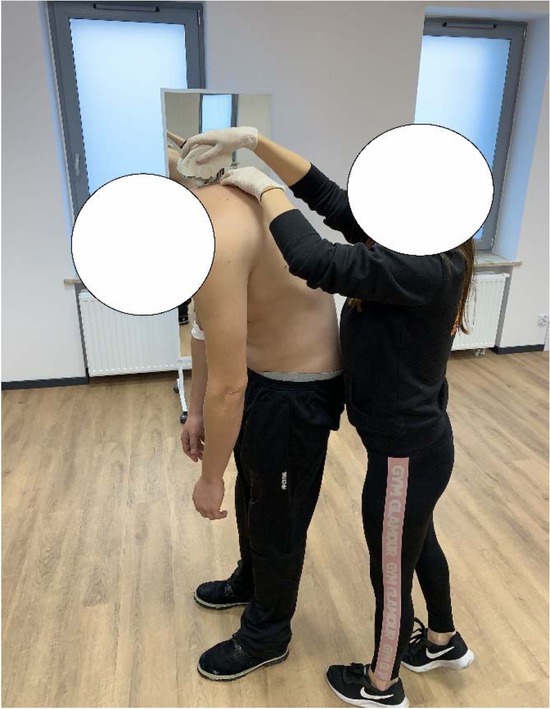
According to the Medi Mouse’s algorithm, the measurements were performed in a standing position, which simultaneously was the habitual position for the studied athletes (only one athlete used a wheelchair in everyday life, nevertheless, he was able to stand on amputation stumps). The examinations were conducted in three different trunk positions, i.e., sagittal standing (arms in the habitual position), sagittal standing flexion (arms in a free stance), and extension (arms crossed on the shoulders, elbows up). The measurement started with placing the Medi Mouse at the C7 level. Next, the device was moved with constant speed up to the S5 level. All measurements were automatically recorded on a computer with Idiag M360 software, which provided the data of (1) the current depth of thoracic and lumbar curvatures, (2) the proper physiological values of the aforementioned curvatures, based on the values obtained from an able-bodied population similar in gender, age, BH and BM, (3) the differences between the current and proper physiological values of thoracic and lumbar curvatures, (4) the type of sagittal spinal curvature deviation, i.e., thoracic hyper/hypo kyphosis, lumbar hyper/hypo lordosis.
Muscular strength measurements
Maximal muscular strength was assessed by the 1RM test in the bench press exercise. Athletes performed a general warm-up including 5 min of the upper body work on an ergometer (Keiser M3i Total Body Trainer, Keiser Corporation, Fresno CA, USA) at 70W resistance, 10 trunk rotations (2 circuits) and 10 arm swings (internal, external, lateral). Thereafter, athletes performed 15, 10, 5 bench press repetitions at 20%, 40% and 60% of the estimated 1RM. The evaluation of maximal strength started at 80% of the estimated 1RM. If the athlete lifted the load, 2.5-10 kg was added to the barbell until the 1RM was reached.
Statistical Analysis
All statistical analyses were performed using the SPSS (version 25.0; IBM, Inc., Chicago, IL, USA). Data are presented as means and standard deviations (SD) with 95% confidence intervals. The normality of the data was confirmed by the Shapiro–Wilk test. Spearman’s rank-order correlation was used to determine the relationship between all measured variables followed by stepwise forward regression. For regression analyses, NMQ-7 results, spinal curvatures and anthropometric values were set as independent variables (predictors) and the 1RM, the percentage of fat mass and visceral fat mass as dependent variables. The common variance between variables was described with the coefficient of determination (R2). Correlations were evaluated as follows: trivial (0.0 – 0.09), small (0.10 – 0.29), moderate (0.30 – 0.49), large (0.50 – 0.69), very large (0.70 – 0.89), nearly perfect (0.90 – 0.99), and perfect (1.0). The level of significance for the correlation and regression analysis was set at p < 0.05.
Results
Table 2 presents the results of the anteroposterior spinal curvatures and spinal deviations in the sagittal plane obtained from the Medi Mouse (Idiag M360), whereas the results of the prevalence and location of musculoskeletal pain based on the NMQ=7 are presented in Table 3.
Table 2
Means and standard deviations (SD) of thoracic kyphosis and lumbar lordosis angles, physiological values, values of spinal deviation and differences between current and physiological values of the aforementioned curvatures in three positions in the sagittal plane.
Table 3
The prevalence (%) and locations of musculoskeletal pain based on NMQ = 7.
| Body (NMQ=parts 7) | Percentage (%) |
|---|---|
| Neck | 33% |
| Shoulders | 25% |
| Upper back | 33% |
| Elbows | 8% |
| Wrists | 25% |
| Low back | 58% |
| Hips/ties | 25% |
| Knees* | 25% |
| Ankles/feet* | 25% |
Based on individual reports from Idiag M360 software, a high prevalence of sagittal spinal curvature deviations was found, i.e., thoracic hyperkyphosis (50%), lumbar hypolordosis (33%), thoracic hypokyphosis (8%) and lumbar hyperlordosis (8%) (Table 2).
As presented in Table 3, the lower back (58%), the upper back (33%) and the neck (33%) were the most frequently reported painful areas. Shoulders, wrists and parts of lower limbs (hips/ties, knees and ankles/feet) showed a similar prevalence of pain (25%). Elbows were found to have the lowest frequency of pain (8%).
The Spearman’s rank-order correlation (Table 4) showed a large positive relationship between lumbar lordosis in sagittal standing extension (r = 0.62; p = 0.03) and a large negative relationship between thoracic kyphosis sagittal standing flexion (r = -0.63; p = 0.28) and the 1RM, moreover, some moderate to large negative correlation values of the NMQ-7 (knees, lower back, shoulders, neck) to the 1RM were found, yet with no significant p values. Regression analyses showed that the thoracic kyphosis in sagittal standing could predict the 1RM values (R2 = 0.41; p = 0.02).
Table 4
Spearman’s rank order correlation between all measured data.
Furthermore, correlation analysis showed a large negative relationship between BAI and thoracic kyphosis sagittal standing flexion (r = - 0.65; p = 0.05) and extension (r = -0.58; p = 0.05) and a large relationship with the lumbar lordosis sagittal standing flexion (r = 0.61; p = 0.05). The BMI showed a high positive correlation with wrist pain (r = 0.59; p = 0.05), whereas a very high relationship was found between wrist pain and knee pain (r = 0.77; p = 0.05).
Neck pain showed a positive correlation between thoracic kyphosis sagittal standing (r = 0.67; p = 0.05), lumbar lordosis sagittal standing (r = 0.67; p = 0.05), and thoracic kyphosis sagittal standing extension (r = 0.64; p = 0.05) and a large negative correlation to lumbar lordosis sagittal standing flexion (r = -0.62; p = 0.05). Similar large negative correlation was found between lumbar lordosis sagittal standing flexion and LBP (r = - 0.61; p = 0.05) and thoracic kyphosis sagittal standing extension (r = -6.16; p = 0.05).
Discussion
The purpose of the present study was to assess whether fat mass and maximal muscular strength of the upper body impacted the prevalence and location of musculoskeletal pain and sagittal spinal curvature deviations in elite Polish sitting volleyball players. The primary finding of the study was that both the lower 1RM in the bench press and excessive body fat mass (estimated by the BAI) correlated with spinal curvature deviations in sagittal standing flexion and/or extension, which contributed to musculoskeletal pain in the neck and the lower back. Moreover, neck pain significantly correlated with deepening of the thoracic kyphosis and/or flattening of the lumbar lordosis in the habitual position.
These findings may be related to internal compensatory mechanisms which may have impacted the muscular imbalance and fat mass distribution. Moreover, the aforementioned factors may have contributed to deviations of the anteroposterior spinal curvatures were found in the majority of participants (especially thoracic hyperkyphosis and lumbar hypolordosis). The results of our study correspond with the findings of Xia et al. (2021) who reported a relationship between upper and lower sagittal compensatory mechanisms, in which the head position relative to the spine was significantly correlated with spinal-pelvic variables and lower lumbar muscles.
Considering the factors related to the prevalence and location of musculoskeletal pain in sitting volleyball players, our results indicate that excessive fat mass (assessed by the corrected BMI, i.e., Brown-Fisher rate) impacted wrist pain in athletes with lower limb deficiency. Furthermore, pain in the wrists correlated with pain in the knee joints. Similar relationships were shown in the systematic review and meta-analysis conducted by Walsh et al. (2018) who identified positive associations between increased body fat mass and single-site joint pain in the lower back, the knee and the foot and suggested that elevated body fat mass may result in increasing joint pain. This issue was also studied by Jankowicz-Szymanska et al. (2019) who demonstrated that excessive body mass (assessed by the BMI) increased the risk of lumbar hypolordosis, whereas Mirbagheri et al. (2015) and Zwierzchowska et al. (2018) found that a greater angle of lumbar lordosis contributed to LBP.
However, it needs to be mentioned that an alternative method to assess body fat mass exists. According to the studies by Zwierzchowska et al. (2013, 2014, 2020b, 2021) the BAI, in contrary to the BMI, seems to be a more reliable marker, especially for people with disabilities. Furthermore, Zwierzchowska et al. (2020b) noticed that a higher BAI contributed to the deepening of the lumbar lordosis and LBP, what is consistent with the findings of Mirbagheri et al. (2015). Our study showed a very large correlation between the depth of anteroposterior spinal curvatures and the BAI. Nevertheless, a higher BAI correlated only with the deepening of the lumbar lordosis in sagittal standing flexion, whereas no connection was found in the habitual position in which participants had mostly normal (58%) or flattened (33%) lordosis. The incompatible results of the presented reports can be explained mainly by differences in characteristics of participants including participants’ age and musculoskeletal impairment. Zwierzchowska et al. (2020b) examined a young (20-22 years old), able-bodied population, whereas our study explored older participants (mean age of 35 years) with musculoskeletal system impairment (lower limb amputation/deficiency).
Furthermore, the majority of sitting volleyball players reported LBP and neck pain that were also indicated as the most common problems in elite able-bodied volleyball players by several authors (Fett et al., 2019; Movahed et al., 2019; Reeser et al., 2015). Therefore, it seems that upper and lower internal compensatory mechanisms (fat mass distribution, muscular imbalance) activated by disturbed body biomechanics may be related to LBP and neck pain.
Several studies have been carried out to assess musculoskeletal pain in able-bodied and disabled athletes (Farahbakhsh et al., 2018; Fett et al., 2019), however, according to the authors’ knowledge, this is the first study to assess fat mass and maximal muscular strength of the upper body as internal compensation for musculoskeletal pain in disabled athletes. Therefore, the results of the present study are of importance for sitting volleyball players and coaches, to minimize the negative effects of internal compensatory mechanisms and enhance athletic performance. Nevertheless, it seems justified to recommend both adapted strength and proprioceptive training to decrease muscular imbalance, postural disturbances and improve neuromuscular control.
Limitations
The present study has several limitations which need to be acknowledged. First of all, even though we explored the entire male Polish sitting volleyball national team, study participants consisted of 12 athletes only, from two disability groups (amputees, Les Autres) what makes any generalizations impossible. Moreover, the results may not transfer to female athletes and athletes with different types of impairment, e.g., spinal cord injuries. Nevertheless, this was a preliminary study which found an interesting relationship between the 1RM and its impact on the thoracic kyphosis and musculoskeletal pain. Thus, further studies are needed to assess this phenomenon. Future research should include more participants from both genders, different types of impairment and sports. These kinds of studies could provide important data to improve athletic performance through the proper prevention of musculoskeletal pain and minimizing the disadvantageous effects of internal compensatory mechanisms.
Conclusions
Despite the marker used to assess the level of body fat mass (BMI/BAI), it was confirmed that body fat mass may impact the depth of anteroposterior spinal curvatures, what may cause LBP and neck pain. Moreover, fat mass (BMI) could result in wrist pain.
The 1RM in the bench press results may impact the prevalence and location of musculoskeletal pain, whereas its values can be predicted by the depth of thoracic kyphosis. Furthermore, a lower 1RM in the bench press results impact spinal curvature deviations in the sagittal plane, whereas deepen thoracic kyphosis and lumbar lordosis significantly contribute to the prevalence of neck pain.