Introduction
Soccer is an intermittent sport that presents physical match demands including accelerations, decelerations, jumps, changes of direction, while requiring a rapid technical and tactical players’ adaptation to face the changing environment, which in turn would contribute to achieving optimal performance (Nédélec et al., 2012). These physically demanding actions are known to impose significant disturbances on body systems, such as the energetic, musculoskeletal, endocrine, and nervous system (de Hoyo et al., 2016; Reilly and Ekblom, 2005). Therefore, fatigue induced by participating in soccer match-play may persist post-match, lasting a couple of days after the competitive match-play (Brownstein et al., 2017).
Particularly in youth soccer players, the competitive schedule can require participating in multiple matches with a minimal recovery interval between them (Moreira et al., 2016; Mortatti et al., 2012, 2020; Zanetti et al., 2021). Usually, these official tournaments, which can be performed during the season, involve one or two matches a day in a short period of time (3 to 7 days) (Moreira et al., 2016; Zanetti et al., 2021). This typical congested match schedule may impose elevated psychophysiological stress on youth players, which could lead to inappropriate recovery, which in turn might negatively affect performance and health of players. These assumptions are based on results of studies which demonstrated that short recovery periods between matches could induce the accumulation of residual fatigue and therefore, disturb the balance between the load and recovery, affecting players’ performance and health (Moreira et al., 2016; Odetoyinbo et al., 2009).
In order to monitor the effect of matchplay fatigue, some measures have been used in the practical setting and examined by researchers (Thorpe et al., 2017). Changes in field tests’ performance, involving vertical jump and sprint tests, for example, in response to match-play have been examined (Nédélec et al., 2012; Thomas et al., 2017). Additionally, self-reported measures (Thorpe et al., 2017) and salivary hormones have also been adopted and investigated to monitor fatigue and psychophysiological responses to matches (Freitas et al., 2016; Moreira et al., 2009), as well as across competitive seasons (Francavilla et al., 2018; Moreira et al., 2016; Mortatti et al., 2012) in both youth and professional soccer players. The assessment of these salivary hormones (i.e., testosterone and cortisol) is widely used to measure the balance between anabolic and catabolic activity (Saidi et al., 2020). Indeed, saliva samples have been largely accepted as an alternative to blood samples and may increase the likelihood of acceptability by the athletes (Abraham et al., 2012) which in turn may contribute to monitoring the psychophysiological effects of successive match loads in youth athletes.
The stressful environment triggered by successive competitive matches has been shown to negatively affect physical performance of youth players (Moreira et al., 2016; Rowsell et al., 2009). Moreover, previous findings suggest that playing successive matches in a short period can negatively affect the technical match performance of U15 soccer players (Moreira et al., 2016). In that study (Moreira et al., 2016), however, it was showed that while the congested fixture could affect testosterone and salivary immunoglobulin A (SIgA) concentrations, [which can lead to an increase in the risk of upper respiratory tract infections (Mortatti et al., 2012)], the salivary cortisol (sC) concentration did not change across the competition. On the other hand, Freitas et al. (2014) demonstrated that intensive training weeks increased internal training loads and resting sC concentration in youth soccer players (U16); and Rowsell et al. (2009) showed a decrease in physical performance (countermovement jump and mean repeated sprint time) and an increase in muscle damage markers (creatine kinase and lactate dehydrogenase activity) after four soccer matches with 24 h of recovery between matches. In addition, an increase in sC from before to immediately after 2 successive soccer matches separated by 24 h in young athletes (U17) regardless of the competitive internal load was recently demonstrated (de Lima Pinto et al., 2019).
The increase in the cortisol concentration can be related to the increase in perceived stress, which in turn can lead to a decrease in the athlete's performance (Park et al., 2020; Tanner and Day, 2017). Thereby, tools for monitoring psychological stress in athletes are commonly used during training and competition. For example, results from previous studies, using the Daily Analysis of Life Demand in Athletes (DALDA) questionnaire, demonstrated that stress tolerance was inversely associated with the internal load in young futsal and tennis players (Gomes et al., 2013; Milanez et al., 2014). Similarly, Tanner and Day (2017) showed a significant correlation between “worse than normal” DALDA responses and higher salivary cortisol concentration in elite female synchronized swimmers. Additionally, decreased stress tolerance showed association with increased upper respiratory tract infection symptoms in soccer players during training (Freitas et al., 2014). However, unlike training sessions, competition periods are marked by greater psychological demands arising from the dispute (for social, winner or faster, stronger status) which contributes to increased psychological stress (Casto and Edwards, 2016; Nicholls et al., 2009). Moreover, the increase in sources of stress generated during competitive matches can result in different symptoms of stress and this response may depend on the day (Nicholls et al., 2009). Therefore, it is essential to understand how congested competition can affect perceived stress and performance of youth soccer players.
Nevertheless, despite the aforementioned findings, there are still few data available in the literature demonstrating the effects of a congested match schedule on a myriad of measures such as the internal match load, self-reported measures, steroid hormonal concentration and physical performance in youth players. Notably, investigation focused on sC responses and stress tolerance together with physical performance across a congested match schedule in youth players is still lacking. Therefore, this study aimed to analyze the effects of four successive matches on the internal match load (IML), stress tolerance, sC concentration and countermovement vertical jump height (CVJH) in elite youth soccer players. It was hypothesized that participating in successive matches with a short recovery time could result in elevated psychophysiological stress that would lead to an increase in sC, a decrease in stress tolerance, and a concomitant decrease in CVJH.
Methods
Design and Procedures
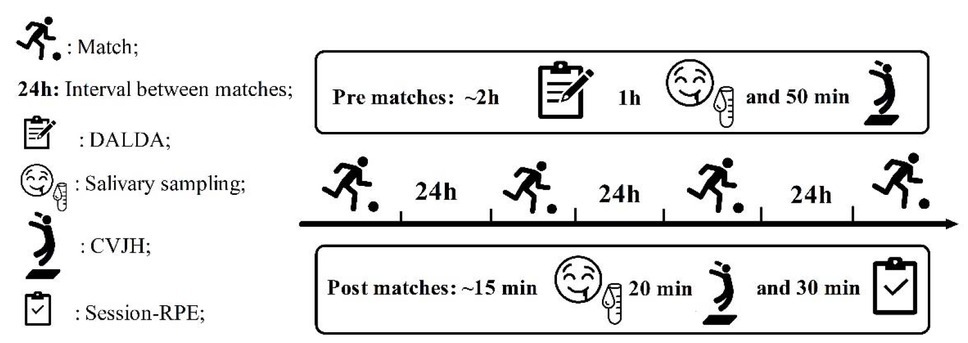
Four matches were played over four successive days with 24 h of rest in between. The assessed matches lasted 80 min (2 x 40 min, with a cooling break of 3 min in each half for hydration, and a 10-min interval between halves). The competition was a regional tournament involving teams from the northeastern and southeastern region of Brazil. The matches were performed at home of the reference team. All matches started at the same time (3:00 PM) and with temperature ranging between 27 and 31⍛C. The reference team won matches 1, 3 and 4 (4:0, 3:0, and 2:0, respectively), and draw match 2 (2:2). Due to the competition rules, the staffing coach was allowed to perform up to five substitutions per match, and players who were substituted could not return back to the match. During the whole period of the competition players were lodged in the same location (hotel), fed 5 times a day with a prescription from the team nutritionist, meeting the minimum requirements for the nutritional standard. In addition, during the matches players had a nutritional complement sports beverage based on water, carbohydrates, and electrolytes. The DALDA questionnaire was filled out 3 days before the beginning of the competition and 2 h before each match to assess stress tolerance. Salivary sampling was taken 50 min before and 20 min after each match. The CVJH test was performed immediately after salivary collection (pre- and post-matches), and the session-RPE was assessed ~30 min after each match (Figure 1).
Participants
Twenty male soccer players from the same team participated in the study. Data from players who participated in at least 50% of each of the four matches were retained for further analysis. Data from 12 players were analyzed (16.6 ± 0.5 years, 175 ± 8 cm, 65 ± 8 kg). All participants were considered healthy and they were free from illness or injury at the time of this investigation. Players regularly trained in the club five days a week following technical-tactical (small-sided games and specific tactical) and physical training (strength training and proprioceptive training) for at least two years. Before the beginning of the study, written informed assent was received from all participants and consent from their parent(s) or guardian(s). The Ethics Committee of the Federal University of Rio Grande do Norte approved this study (no: 1.526.157).
Measures
Match intensity and Internal Match Load
To quantify the players perceived match intensity, the Session Rating of Perceived Exertion (sRPE) was adopted (Foster, 1998). Approximately 30 min after the end of each match or after substitution of the player, the player was asked "how was your match?” according to the CR10 perceived exertion scale and in accordance with previous studies with youth soccer players (Moreira et al., 2016; Mortatti et al., 2012). Players had already been familiarized with this procedure during their regular training sessions and previous matches. Moreover, the internal match load (IML) was determined. The numerical value indicated in the CR10 perceived exertion scale was multiplied by playing time (PT) of each player to determine his internal match load (IML) (sRPE × PT) (Foster, 1998). The monotony index (MI) and competitive strain (CS) were also estimated. The MI was calculated by the daily mean of the match-load of the four matches divided by the standard deviation to determine the level of variability of the competitive load, while CS was calculated from the product of the competitive load and monotony (Foster, 1998).
Stress tolerance
The Daily Analysis of Life Demand in Athletes (DALDA) questionnaire (Rushall, 1990) was filled out 2 h before each match, according to the procedure adopted by Freitas et al. (2014). The DALDA questionnaire was divided into Part A and Part B, representing the sources of stress and symptoms of stress, respectively. The possible answers for each item were: “better than normal”, “normal” and “worse than normal”. According to Freitas et al. (2014), different scores were attributed for each concept: 1 for “worse than normal”, 2 for “normal” and 3 for “better than normal”. The score obtained through the sum of these values indicated individual stress tolerance. A high score indicated that the player was more tolerant to stress and vice-versa. Part A and part B of the DALDA questionnaire were analyzed and presented separately.
Saliva collection and assessment
Saliva samples were collected 50 min before (pre-match) and 20 min after (post-match) each match. Pre-saliva collection occurred in the afternoon at the same time of the day (02:00 PM). Participants abstained from food and caffeine products for at least 90 min before saliva collection. Immediately before saliva sampling players were encouraged to wash their mouths with distilled water in order to eliminate possible waste. The saliva was collected, without stimulation in 15 ml sterile centrifuge tubes over a 5-min period, in accordance with previous studies (Moreira et al., 2016; Mortatti et al., 2012). Participants were in a seated position, with their eyes open, with the head slightly bent forward, making minimal orofacial movement not to stimulate salivary secretion. Immediately after the collection, the tubes were stored in dry ice and transported to the laboratory where they were stored at -80° C until the moment of analysis. After thawing and centrifugation, the samples of sC concentration were measured in duplicate using an enzyme-linked immunosorbent ELISA assay (Cortisol ELISA, IBL, International, GMBH). The average intra-assay coefficient of variation was less than 7%.
Countermovement vertical jump height measurement (CVJH)
The CVJH test is a practical, valid, and reliable measure of lower-body power, and it is habitually used to monitor athletes’ conditioning programs (Van Hooren and Zolotarjova, 2017). The CVJH test was performed following the procedures of Laffaye et al. (2014), and the data were collected before and after each match. All participants performed 3 trials with 10 s of rest between them, and the highest score was considered for statistical analysis. The delta change was used to compare CVJH. The jumping tests were performed using a Jump System Pro contact platform (CEFISE, Brazil). The intraclass correlation coefficient between CVJH measurements was 0.96.
Statistical analysis
Data normality was tested using the Shapiro-Wilk test. The Mauchly test was used to verify the sphericity and the Greenhouse-Geisser correction was used when necessary. Data are expressed as mean, standard deviation (SD), mean difference (MD), confidence interval 95% (CI) and percent change (Δ%). The T test was used to analyze the acute effect (pre and post) of each match in sC and CVJH, additionally "d" Cohen (1988) was used to estimate the effect size (ES), with small ES (0.20–0.49), medium ES (0.5–0.79), and large ES (> 0.8). A repeated-measures ANOVA was used to compare the dependent variables i.e., playing time (PT), sRPE, internal match load (IML), sources and symptoms of stress (part A and part B, were analyzed separately), delta salivary cortisol [post - pre] and delta CVJH across the assessed matches. Partial eta squared effect sizes (η2) were reported and interpreted according to Ferguson (2009): no effect (ES < 0.04), minimum effect (0.04 < ES < 0.25), moderate effect (0.25 < ES < 0.64) and strong effect (ES > 0.64). The Bonferroni’s post hoc test was used to locate significant differences. For sC and CVJH the minimal detectable change (MDC) was calculated based on the standard error of measurement (SEM), coefficient of variation (CV) and intraclass correlation coefficient (ICC model 2,k with absolute agreement) according to Mallinson et al. (2016). MDC was calculated based on 95% intervals (ICs) (MDC95). For all analysis, a p-value < 0.05 was considered significant. The statistical package SPSS® 19.0 for Windows was used for statistical analysis.
Results
The results of all dependent variables are presented in Table 1. The average playing time (PT) during the competition was 64.5 ± 9.3 min. Differences were shown between matches (F (3,33) = 10.84, p < 0.001, η2: 0.49 [moderate effect]. A lower PT in match 3 (48.8 min) and a higher PT in match 2 (73.3 min) were observed. There was no significant difference in the IML among the matches (F (3,33) = 1.68, p = 0.132, η2: 0.13 [minimum effect]). The sRPE did not show differences between matches (F (3,33) = 1.68, p = 0.190, η2: 0.13 [minimum effect]). The MI and strain were 4.3 ± 2.3 AU and 8104 ± 6795 AU, respectively. The sources (DALDA, part A) and symptoms (DALDA, part B) of stress did not differ between matches (sources: F (3,33) = 0.289, p = 0.832, η2: 0.02 [no effect] and symptoms: F (3,33) = 0.927, p = 0.438, η2: 0.07 [minimum effect]).
Table 1
Results for each assessed match (mean ±SD).
[i] PT = playing time; sRPE = session rating of perceived exertion; IML = internal match load; ST = stress tolerance **represented by the sum of the different scores attributed to each concept from DALDA part A (sources of stress) and B (symptoms of stress). sC = salivary cortisol; CVJH = Countermovement vertical jump height. aDifference to match-1,2 and 4; † difference to match-4; ‡ difference to pre.
Salivary cortisol increased post-match 1 (t (11) = 2.56, p = 0.02, ES: 0.7 MD: -3,16, CI -5.88 to - 0.45) match 2 (t (11) = 2.93, p = 0.01, ES: -0.8 MD: - 5.29 CI: -9.26 to -1.31), and match 4 (t (11) = 2.59, p = 0.02, ES: 0.8, MD: -3.19, CI: -5.89 to -0.48). The ΔsC across the matches varied within a range from 59 to 226%. Additionally, the delta of the salivary cortisol (ΔsC; from match 1 to match 4) did not differ between matches (F (3,33) = 1.13, p = 0.35, η2: 0.09 (minimum effect)).
The CVJH performance increased from pre- to post-match in match 1 (t (11) = 2.51, p = 0.02, ES: -0.9, MD: -1.15 IC: -2.17 to -0.14), match 2 (t (11) = 2.45, p = 0.03, ES: -0.5, MD: -1.16 IC: -2.21 to - 0.12) and match 3 (t (11) = 2.54, p = 0.02, ES: -0.7 MD: -1.34 IC: -2.49 to -0.18). In match 4 a decrease in CVJH performance was observed (t (11) = 2.85, p = 0.01, ES: 0.8, MD: 1.86 IC: 0.42 to 3.30). The ΔCVJH (from match 1 to match 4) differed significantly between matches (F (3,33) = 8.64, p < 0.001, η2: 0.44 [moderate effect]) presenting a decrease from matches 1, 2 and 3 to match 4 (Match 1 vs. Match 4 MD: 3.02; CI: 0.93 to 5.11, Match 2 vs. Match 4 MD: 3.03; CI: 0.94 to 5.12 and Match 3 vs. Match 4 MD: 3.20; CI: 1.11 to 5.29). The Δ% of CVJH during competition ranged from 3.1 to -5.1%.
The MDC 95% of sC and CVJH is shown in Table 2, considering the intraclass correlation coefficient and standard error of measurement obtained before the training session and match 1.
Table 2
Reproducibility, standard error or measurement, and minimal detectable change values between pre-training and pre-match 1. sC and CVJH from measurements repeated with a 72 h interval.
| Mean ± SD* | ICC | SEM | MDC (95%) | |
|---|---|---|---|---|
| sC (ng·mL-1) | 2.4 ± 2.5 | 0.102 | 2.3 | 4.2 |
| CVJH (cm) | 37.1 ± 3.5 | 0.878 | 1.2 | 3.0 |
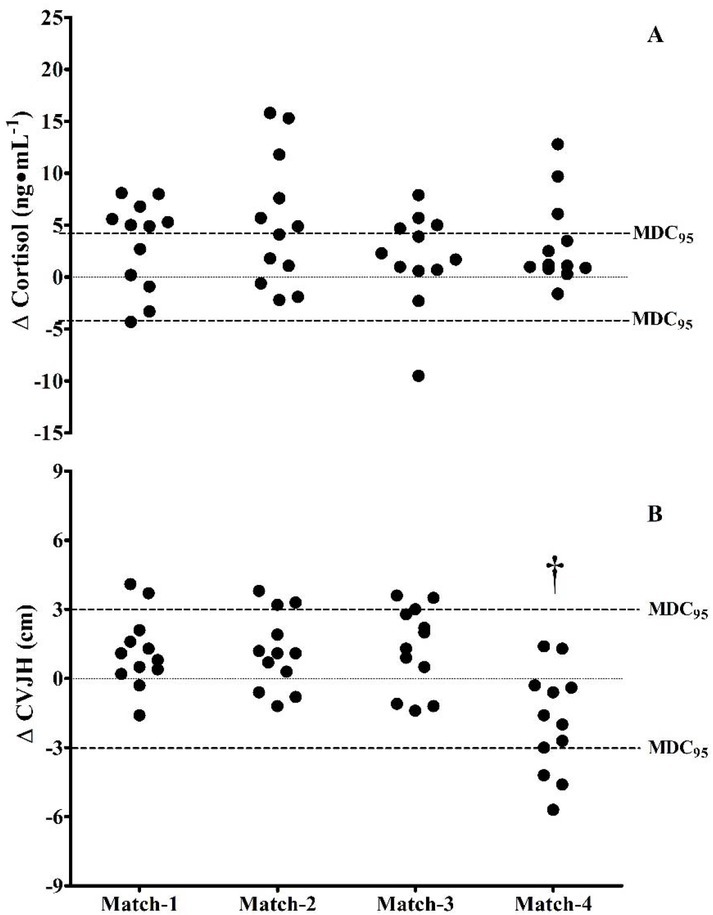
Figure 2 shows individual changes (pre- to post-match) in sC (Figure 2A) and CVJH (Figure 2B). For sC, 58% of players exceeded the values determined by the MDC95 in match 1 and 50% in match 2, while in matches 3 and 4 players showed increases in post-match sC above the MDC95, 33% and 25%, respectively. Regarding ΔCVJH in matches 1, 2 and 3 there was no individual negative change below the MDC95; however, in match 4 25% of the players presented a fall in ΔCVJH.
Discussion
The aim of the study was to analyze the effects of four successive matches on the IML, stress tolerance, salivary cortisol concentration (sC) and CVJH in U17 male soccer players during an official regional tournament. The results of the present study showed no significant change in the IML, sRPE, stress tolerance and sC across the matches. However, there was an increase in delta values (pre- to post-matches) for sC in three of the four played matches. In addition, there was a decrease in CVJH performance across successive matches.
Match intensity and Internal Match Load
The IML was similar among the four assessed matches (the IML ranged from 400 to 500 AU, approximately). These data are in line with those reported in previous studies (Freitas et al., 2016; Rabbani et al., 2018). Rabbani et al. (2018), for example, demonstrated slightly higher IML average values (569 AU) for soccer players participating in 4 successive matches with a 48-h interval in between; however, in the Rabbani et al.’s (2018) study, the duration of the matches was 90 min, while in the present study, the assessed matches lasted 80 min. This difference (playing time) could at least in part explain the slight differences in the IML between the current study and that by Rabbani et al. (2018). The playing time influences the IML as this measure is estimated by the product of volume (playing time) and perceived intensity. This feature might also explain a reported lower IML value (~225 AU) in two successive soccer matches (2 halves of 30 min) performed with 24-h of rest by U17 soccer players (de Lima Pinto et al., 2019).
Interestingly, regarding the sRPE used as a marker of the match intensity, the result was similar to that observed for the IML. There was no significant change in the sRPE across the matches. This result suggests that possible accumulated fatigue associated with participating in successive matches during the investigated competitive schedule did not influence the perceived intensity of youth players. The present results are in line with previous findings reported by Moreira et al. (2016) who showed no increase in the sRPE for seven consecutive matches played in 7 days in youth soccer players; however, it is important to mention that in the study of Moreira et al. (2016) the matches were played in two halves of 20 min, and after the first four matches, there was a 3-day period of recovery before the following competition. While it is difficult to compare the results due to differences in the format of the congested schedule, in conjunction, these findings suggest that the perceived effort seems not to be affected in this type of competition in youth players.
It is worth mentioning that the sRPE can be influenced by some factors (Haddad et al., 2017), including situational factors such as the importance of the match. For example, research in other sports has shown higher sRPE values during final matches of the competition compared to those observed in regular or semifinal matches (Arruda et al., 2018; Moreira et al., 2013). However, the influence of the importance of the match on the sRPE in youth soccer players is not yet clear. Mortatti et al. (2012) demonstrated an increase in the sRPE in the last 3 matches (two halves of 45 min) from a total of 7 matches played in 20 days. These last 3 matches were played during the playoff stages, while the other four were played during the group stage, suggesting that players perceived a higher match intensity during the decisive and more important matches of the competition. Nevertheless, in the study of Moreira et al. (2016) the results showed no significant changes in the sRPE across the competition. Differences in the format of the competition may at least in part explain the differences in the results of the Mortatti et al.’s (2012) study, and those from the current investigation and the study by Moreira et al. (2016), as for both, there is no clear distinction between stages of the competition. One possible alternative explanation for the absence of changes in the sRPE in the present study that cannot be ruled out, could be the adoption of self-regulation of the physical effort or pacing strategy (Bradley and Noakes, 2013). The pacing strategy could be an important factor to explain the ratings of perceived exertion responses (Abbiss et al., 2015). Indeed, it has been proposed that pacing strategy may be influenced by numerous factors including the knowledge of exercise end-point and bout duration (Waldron et al., 2013). It can be speculated that the assessed players in the present investigation adopted behavioral strategies during matches and across the successive matches to minimize undesirable increases in the effort level while maintaining an appropriate performance, which in turn, may have led to the maintenance of the perceived effort throughout the competition. This aspect could be considered in further studies to empirically test the influence of the pacing strategy on the sRPE during periods of congested match schedules in youth players taking into account that the stage of the competition may actually influence the level of perceived effort.
Stress tolerance
Another important result of the present study was the absence of change in stress tolerance of youth players, suggesting that they appropriately coped with stress induced by competition. Freitas et al. (2014) observed similar results for stress tolerance in youth players assessed during two different training phases (overload and tapering periods). Those authors attributed this response to the appropriate management of stress by the assessed players. Despite the reported increase in perceived effort and salivary cortisol during the overloading phase, and a consequent decrease of these markers during the tapering phase, stress tolerance of players was not affected. Contrary to these results, Figueiredo et al. (2019) reported a significant decrease in stress tolerance of U19 soccer players during the overload period when compared to the tapering period. These conflicting results are difficult to explain, but they suggest that changes in stress tolerance can occur or not despite changes in the load and perceived effort of team sports athletes. Indeed, these findings also demonstrate the importance of monitoring stress tolerance together with markers of the load (training or competitive load) as they represent different constructs and are able to measure different aspects of the athletes’ response to training or competition.
Salivary cortisol concentration
Regarding the effect of the match (pre- to post-match) on salivary cortisol (sC) concentration, data of the present study demonstrated the expected result for the sC dynamics; stress induced by participating in official matches elevated sC of the assessed youth players, likely, due to the activation of the hypothalamus-pituitary-adrenal axis (HPA) in response to the psychophysiological stress. Thus, these findings corroborate others suggesting that there is a high psychophysiological requirement in this type of competitions (Moreira et al., 2016; Zanetti et al., 2021) which in turn can be represented by increases in salivary cortisol concentration from pre- to post-matches.
Few studies have attempted to demonstrate the effect of successive CFS matches on sC responses for each match. De Lima Pinto et al. (2019), for example, demonstrated that there was no difference in salivary cortisol increases in two successive matches played 24 hours apart in U17 soccer players, while Rowell et al. (2017) found a range of variation between 54 and 165% according to the match loads (low, medium and high loads during the matches) for elite soccer players. In general, these results and those of the current investigation reinforced the stressor nature of official match play, regardless the age category. However, they also indicate that many aspects such as the opponent level might be involved in the variability of this response. Indeed, it seems that playing successive matches within a tournament, in particular when there are no clear competition stages, may not affect the expected sC responses.
Combining stress tolerance and hormonal response, we observed no increase in the salivary cortisol response (from match 1 to match 4) and stress tolerance. Such a response may be associated with allostasis, which is an essential component of maintaining homeostasis in the event of stressful situations, and the allostatic load which refers to chronic demand to the body and brain which requires adaptation of physiological systems (Hackney, 2006; McEwen, 1998). Thus, repeated events with different forms of psychophysiological stress (repeated competitive matches) did not lead to an increase in the allostatic load and this may have contributed to an attenuated response to stress tolerance and salivary cortisol (Hackney, 2006; McEwen, 1998).
Countermovement vertical jump height
The ΔCVJH performance significantly increased from pre- to post-match in the first three matches. This result is likely to be explained due to the twitch potentiation effect occurring after competitive matches. This condition has been described in the study of Boullosa et al. (2011) who demonstrated an increase in vertical jump performance in endurance athletes after a running protocol until exhaustion; and that of Castillo et al. (2018) who verified an increase in performance in the vertical jump in field and assistant referees after competitive soccer matches. However, in match 4 there was a decrease in delta CVJH (pre-to post-match 4). Beside this result, the delta values of CVJH from match 1 to match 4 showed a reduction in muscular performance, suggesting a negative effect of successive matches on the capacity to generate power.
These results suggest that at the beginning of the competitive schedule, the effect of potentiating could occur, but, on the other hand, accumulated fatigue from playing successive matches led to the occurrence of fatigue. These findings should be taken into account by coaches working with youth soccer players during this type of competition. Indeed, the results also indicate that using the countermovement jump to monitor changes in neuromuscular fatigue related to the participation in congested fixtures may be a useful approach for coaches. The validity of adopting the countermovement jump to monitor neuromuscular fatigue has been demonstrated, for example, by Gathercole et al. (2015) who showed its high repeatability, immediate, and prolonged fatigue-induced changes, suggesting this test as highly suitable for neuromuscular fatigue monitoring.
Limitations
Although we find this study of great importance, some limitations should be considered. This analysis was performed with players from a single team and during only one championship. In addition, the lack of an objective measure of the external load (e.g. GPS or PlayerLoad) during matches may limit the understanding of physical stress to which athletes were subjected during the tournament. Another factor that we can highlight is the fact that we did not use control variables for maturation, although the maturation variations may have great influence on performance at younger ages. Even considering such limitations, the present work deserves to be highlighted because of its significance within the context of ecological validity.
Conclusions
In summary, the results of this research suggest that the IML and sRPE are not affected by playing four successive matches, with 24 h of recovery in between. Indeed, the accumulated load and low variability of the competitive congested match schedule did not lead to changes in stress tolerance and sC responses across the matches; moreover, the present results show that this type of competition could induce a decrease in youth players’ jumping performance after the fourth match.
The current findings suggest that practitioners and coaches may monitor vertical jump performance as a marker of neuromuscular fatigue during the accumulated match schedule in youth soccer players, while being aware that these changes seem to be not associated with the capacity of players to cope with stress of competition and the inherent load monotony. Coaches should recognize that even when players are coping appropriately with stress of the competition, their neuromuscular capacity could be negatively affected.