Introduction
Notational performance analysis is indispensable for racket sports with the aim of objectively evaluating performance to provide guidance for future training and match preparation (Hughes and Bartlett, 2002; Malagoli Lanzoni et al., 2014; McGarry and Franks, 1994; O’Donoghue and Ingram, 2001). Among this group of sports, table tennis is unique due to the limited playing surface and the small and light ball for play, which requires excellent technical and tactical skills of athletes to master the fast pace, high velocity, diverse spin and everchanging placement (Tamaki et al., 2017; Wang, 2019).
Table tennis is a dyadic sport with equal alternate possession (McGarry et al., 2002). The basic unit for players to compete is a rally. It is a process where both sides take turns to hit the ball to a certain placement in the hope of opponent’s failure to return (Malagoli Lanzoni et al., 2014). The structure of a rally consists of two components, which are the individual stroke (shot) and the sequence of play. The server executes the service and performs strokes on the odd number shots, called shots in the service round. The receiver performs strokes on the even number shots and they are named shots in the reception round (Zhang et al., 2013). Due to the non-restrictive character of the service as the starter (the first shot) of a rally, players could fully use it to fulfill their tactical intensions, either to set up the following attack to score directly or to establish a favorable situation in the early stage of a rally (Gómez et al., 2017; Tamaki et al., 2017; Wang, 2019). As the rally length extends, the influence of the service on the rally outcome will gradually diminish (Gómez et al., 2017; Tamaki et al., 2017). Correspondingly, for the receiver, an effective return of the service (reception) is vital to neutralize the impact of the service through attacking directly or getting prepared for attacking afterwards (Wang, 2019). During the rally competing process, techniques used, except the service, have been categorized into three types, which are offence, defense and control (Pfeiffer et al., 2010).
Different methods have been employed for table tennis performance analysis. Based on a single shot as the unit of analysis, researchers studied the effectiveness of each shot number (Tamaki et al., 2017), stroke technique (Malagoli Lanzoni et al., 2014), shot placement (Malagoli Lanzoni, et al., 2014; Wang, 2019), the ball traveling route (Guo et al., 2020) and the stroke position (Wang, 2019). The advantage of the analysis of the shot character is that it could provide detailed information which affects performance, but the results isolate player’s successive strokes from one another.
To score a point is rather the effort of the combination of two or more shots than a single stroke (Wu et al., 2016). Moreover, tactical intentions and technical utilization are varied in different phases of a rally. Chinese researchers initially divided a rally competing process into three separate and sequential phases based on the shot number, namely the serve and attack phase (the first and the third shots), the receive and attack phase (the second and the fourth shots) and the stalemate phase (the fifth shot and the following) (Zhang et al., 2018). Performance was evaluated based on the scoring rate and the usage rate of variables of the three phases (Fuchs et al., 2018). This method has been known as “the three-phase indices evaluation method” and has been widely employed for table tennis match performance analysis (Zhang et al., 2013). As the competing features of table tennis matches evolved with the change of rules and equipment, as well as the development of techniques and tactics, several derived phase division structures were proposed, aiming at providing more suitable analytical frameworks for performance analysis. The representative ones were the four-phase evaluation structure (Yang and Zhang, 2014), the double five sections structure (Jiang and Yao, 2015) and the dynamic three-phase structure (Zhang et al., 2018). Overall, the phase division methods assess a player’s performance according to the technical and tactical abilities to score in different phases of a rally. The results are effective to guide training and match preparation. However, performance variables only describe actions of the targeted player, which makes the information for analysis incomprehensive, considering that the opponent’s actions are also important factors to affect performance (McGarry et al., 2002; O’Donoghue, 2009).
Interaction between table tennis players was introduced into modelling by Pfeiffer et al. (2010) who modeled a table tennis rally as a finite Markov Chain process transiting between players’ actions (in progress) until absorbed (finished). Performance variables consisted of bilateral actions instead of the unilateral action. However, as the theoretical assumption of the model was that the next action is only in correlation with the current action and irrelevant to the preceding actions, only the two successive strokes (one exchange) were included rather than the whole shot exchanging path. In this regard, assuming that a point is scored by the serve and attack of a player, it is the successful serve strategy that decreases the quality of the opponent’s return and facilitates the following attack. Therefore, under such circumstances, the contribution of a serve as a previous action to score should be counted in (Wu et al., 2016).
Later, modified bilateral models, such as the Logistic Regression Model (Wu et al., 2016) and the Double Factors (technique and placement) Model (Zhang and Zhou, 2017) were successively proposed. Variables in those models largely restored the process of performance by describing the rally competing process based on the stroke after stroke pattern to evaluate performance. However, since recording each single stroke, especially for long rallies, is complicated, only the initial three or four strokes were included in the modelling. This would make the analysis of rallies finished by multiple exchanges less accurate, for the impact of the serve and the following attack would fade away as the shot number increases (Tamaki et al., 2017).
Hence, a further modified structure for table tennis performance analysis is requisite to enhance the effectiveness of table tennis performance analysis. Inheriting the unique strength of the phase division methods and overcoming their weaknesses by modelling bilateral actions, the process of performance and, additionally, key athletic behavior (shot perturbation) on producing the rally outcome (McGarry et al., 2002), this study proposed an Interactive Three-Phase Structure for table tennis performance analysis.
Therefore, the purpose of this study was twofold. First, to build a novel structure for table tennis performance analysis. Second, to apply it to investigate elite men’s singles matches that represent the table tennis competitions of the world’s highest level. The assumption was that Phase 2 (initial attack and counterattack phase) of the proposed structure was decisive for the rally outcome of elite men’s singles matches.
Methods
Analytical structure
The proposed Interactive Three-Phase Structure divides a rally competing process (RCP) into three separate and ordinal phases, which are the mutual restriction phase (Phase 1), the initial attack and counterattack phase (Phase 2) and the topspin exchange phase (Phase 3). The criteria for phase division are based on the change of tactics and techniques during the RCP. Phase 2 as the transition phase connecting Phase 1 and Phase 3 is regarded as the critical juncture that could greatly perturb and destabilize the RCP and result in rally cessation. Figure 1 and Table 1 present the framework and features of the Interactive Three-Phase Structure. The classifications and operational definitions of variables included in the proposed structure are adapted from Malagoli Lanzoni et al. (2014), McAfee (2009), Pfeiffer et al. (2010), Wang (2019) and are outlined in Table 2.
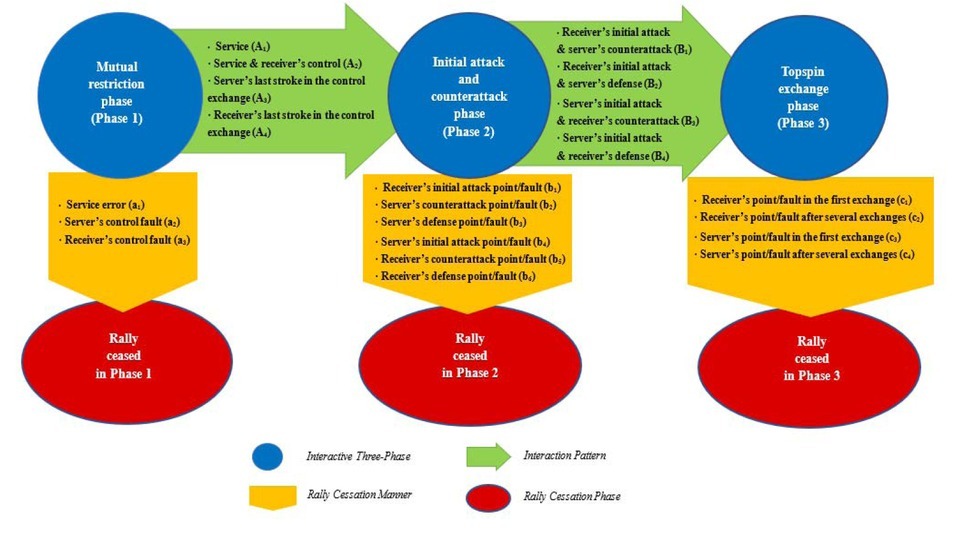
Table 1
Tactical and technical features of the Interactive Three-Phase Structure.
Table 2
Operational definitions and classifications of the technique type, rally outcome, interaction pattern, rally cessation manner and rally competing process (adapted from Malagoli Lanzoni et al., 2014; McAfee, 2009; Pfeiffer et al., 2010; Wang, 2019).
Match sample
A total of 56 elite men’s singles matches of the 2018 ITTF World Tour Platinum including Qatar Open, German Open, China Open, Korea Open, Australian Open and Austrian Open, and 2018 ITTF World Tour Grand Finals were included in the study. In order to collect a representative sample, only the last three rounds (4 quarter finals, 2 semi-finals, 1 final) of each World Tour Platinum and all 14 matches of World Tour Grand Finals (the result of one first round match was automatically decided due to drop out of one player) were included. Fifty-four matches were played between players within world’s top 36. For the remaining two matches, one match involved players of world’s No. 5 and world’s No. 60 and the other was between players of world’s No. 67 and world’s No. 142. The rankings of players were according to the world ranking in December 2018. All the sampled matches were played between offensive style players according to the definition of McAfee (2009). Among the total of 5509 rallies played, two rallies were unrecognizable because of the recording problem of the video. Therefore, 5507 rallies were analyzed eventually. All the sampled matches were observed from the website “https://www.zhibo.tv/”, the authorized website by the ITTF to broadcast its official competitions publicly. Therefore, written consent from the observed participants was not required.
Data collection and reliability
Two professional table tennis analysts, both with more than seven years of experience in table tennis match analysis, participated in the data collection. Prior to the formal procedure, a training session was held to understand the Interactive Three-Phase Structure. Afterwards, a preliminary study was conducted on two randomly chosen matches (261 rallies) to test intra-observer and inter-observer reliability.
The intra-observer reliability was assessed on separate occasions with a two-week period in between by the leading analyst. The inter-observer reliability was tested by comparing the results of the second analyst to the initial observation of the leading analyst. The intra-observer and inter-observer reliability was measured by the calculation of Cohen’s Kappa value (Cohen, 1960). Kappa values of intra-observer reliability were 0.97, 0.99, 0.96 and 1.00 and Kappa values of inter-observer reliability were 0.92, 0.89, 0.85 and 1.00 for the interaction pattern (IP), rally cessation manner (RCM), rally competing process (RCP) and rally outcome (RO) variables, respectively. The results were characterized by very good strength of agreement across all the four variables based on the Altman’s (1991) evaluation scheme for Kappa value.
Statistical analysis
Each sampled rally was coded down according to the Interactive Three-Phase Structure developed in the current study. Descriptive analysis was conducted using Microsoft Excel (Version 16.0.1, Microsoft Cooperation, USA) to calculate the relative frequencies of each variable. Data were further analyzed using the SPSS (Version 24.00 SPSS Inc., USA) with the chi-square test. The test of goodness of fit was performed to make comparison between the expected equal frequency distribution and the observed frequency distribution of (a) the cessation phase of the RCP, (b) the rally cessation manner of Phase 1, (c) the interaction pattern from Phase 1 to Phase 2 (IP1-2) of the RCP ceasing in Phase 2, and (d) IP1-2 of the RCP ceasing in Phase 3. The test of independence was performed to check the relationship between the RCP ceasing in Phase 2 and Phase 3 with the same IP1-2 and the rally outcome (RO). All statistical tests in the study were fit to the requirement of the chi-square test that at least 80% of cells in the cross-tabulation must have an expected frequency of at least five. The Cramer’s V Coefficient (V) was calculated to quantify the degree of correlation. The criteria of values were described as small (V = 0.10), medium (V = 0.30) or large (V ≥ 0.50) (Gravetter and Wallnau, 2007). The alpha level was set at .05.
Results
Cessation phase of the RCP
Table 3 shows the frequency distribution of the cessation phase of the RCP. There was a significant difference between the observed frequency distribution and the expected equal frequency distribution (χ2 = 1446.030, p < 0.001). The RCP ceasing in Phase 2 accounted for 62.9% of the RCP analyzed, the largest amongst all the three phases.
Table 3
Cessation phase of the rally competing process and rally competing process ceasing in Phase 1. Data are shown as absolute frequencies and percentage occurrence (brackets). (N = 5507; N = 391)
| Variable | n | χ2 | Sig. | ||
|---|---|---|---|---|---|
| P1 | 391 (17.6%) | 1446.030 | <0.001 | ||
| CPRCP | P2 | 3462 (63.6%) | |||
| P3 | 1654 (30.0%) | ||||
| a1 | 56 (14.3%) | 52.435 | <0.001 | ||
| RCM1 | a2 | 117 (29.9%) | |||
| a3 | 218 (55.8%) |
RCP ceasing in Phase 1
Table 3 also displays the frequency distribution of the rally cessation manner of Phase 1 (RCM1). There was a significant difference between the observed frequency distribution and the expected equal frequency distribution (χ2 = 52.435, p < 0.001). Receiver control fault (a3) was the most frequent occurring RCM1 that accounted for 55.8% of the RCP ceasing in Phase 1 (RCP1), with the least frequent RCM1 being service error (a1) (14.3%).
RCP ceasing in Phase 2
Table 4 shows the frequency distribution of the interaction pattern from Phase 1 to Phase 2 (IP1-2) as the preceding actions for the RCP ceasing in Phase 2 (RCP2). There was a significant difference between the observed frequency distribution and the expected equal frequency distribution (χ2 = 691.162, p < 0.001). Service (A1) was the most frequent IP1-2 that accounted for 45.2% of the RCP2. Additionally, 31.7% of the RCP2 starting by the service and receiver’s control (A2), which was the second frequent IP1-2. The server’s last stroke in the control exchange (A3) and the receiver’s last stroke in the control exchange (A4) accounted for 17.2% and 5.8% of the RCP2 respectively.
Table 4 also demonstrates the specific RCP2 in relation to the rally outcome (RO). For the RCP2 beginning by A1, the rally cessation manner of Phase 2 (RCM2) was significantly in medium association with RO (χ2 = 197.541, p < 0.001, V = 0.355). The server’s counterattack (b2) scored 48.7% of points. However, the receiver’s initial attack (b1) and server’s defense (b3) only scored 12.0% and 20.3% of points respectively. For the RCP2 beginning by A2, there was a significant small association between RCM2 and RO (χ2 = 61.070, p < 0.001, V = 0.236). The receiver’s counterattack (b5) lost the least proportion of points (58.7%) amongst the three RCM2. For the RCP2 beginning by A3, there was a significant small relationship between RCM2 and RO (χ2 = 39.382, p < 0.001, V = 0.257). b2 scored 44.7% of points, better than b1 and b3 (26.2% and 12.0% respectively). For the RCP2 beginning by A4, RCM2 showed a significant small association with RO (χ2 = 14.594, p = 0.001, V = 0.269). b6 was the lowest point scoring RCM2 (10.7%), whereas b5 was the highest (41.6%).
Table 4
Rally competing process ceasing in Phase 2. Data are shown as absolute frequencies and percentage occurrence (brackets) (N = 3462).
[i] IP1-2: interaction pattern from Phase 1 to Phase 2; A1: service; A2: service and receiver’s control; A3: server’s last stroke in the control exchange; A4: receiver’s last stroke in the control exchange. RCM2: rally cessation manner of Phase 2; b1: receiver’s initial attack point/fault; b2: server’s counterattack point/fault; b3: server’s defense point/fault; b4: server’s initial attack point/fault; b5: receiver’s counterattack point/fault; b6: receiver’s defense point/fault.
RCP ceasing in Phase 3
Table 5 shows the frequency distribution of IP1-2 as the preceding actions for the RCP ceasing in Phase 3 (RCP3). There was a significant difference between the observed frequency distribution and the expected equal frequency distribution (χ2 = 389.267, p < 0.001). The most frequent IP1-2 was A1 which accounted for 49.3% of the RCP3. The rest of IP1-2 accounted for the remaining 50.7% of the RCP3 with 29.9% being A2, 15.6% being A3 and 5.2% being A4.
Table 5
Rally competing process ceasing in Phase 3. Data are shown as absolute frequencies and percentage occurrence (brackets) (N = 1654).
[i] IP1-2: interaction pattern from Phase 1 to Phase 2; A1: service; A2: service and receiver’s control; A3: server’s last stroke in the control exchange; A4: receiver’s last stroke in the control exchange. IP2-3: interaction pattern from Phase 2 to Phase 3; B1: receiver’s initial attack and server’s counterattack; B2: receiver’s initial attack and server’s defense; B3: server’s initial attack and receiver’s counterattack; B4: server’s initial attack and receiver’s defense. RCM3: rally cessation manner of Phase 3; c1: receiver’s point/fault in the first exchange; c2: receiver’s point/fault after several exchanges; c3: server’s point/fault in the first exchange; c4: server’s point/fault after several exchanges.
Table 5 also displays the specific RCP3 in relation to the RO. There were significant associations between the RCP3 with the receiver launching initial attack and the RO. For the RCP3 beginning by A1, the interaction pattern from Phase 2 to Phase 3 (IP2-3) and the rally cessation manner of Phase 3 (RCM3) showed a significant small association with the RO (χ2 = 9.018, p = 0.029, V = 0.105). The receiver scored a larger proportion of points by server’s defense (B2) than by server’s counterattack (B2) in Phase 2 and ending by both in the first exchange (c1) (84.8% vs. 65.7%) and after several exchanges (c2) (72.7% vs. 60.7%) in Phase 3. For the RCP3 beginning by A3, IP2-3 and RCM3 presented a significant small relationship with the RO (χ2 = 9.633, p = 0.022, V = 0.193). The receiver scored a greater proportion of points by the RCP3 continuing with B2 than by B1 for the RCP3 ending by both c1 (80.6% vs. 60.9%) and c2 (80.0% vs. 54.6%).
Discussion
Cessation phase of the RCP
Considering the cessation phase of the RCP in general, the probability of the RCP to end in Phase 2 was predominant amongst the three phases. This verifies the assumption that the initial attack and counterattack were two critical shots to determine the rally outcome between elite male players. The transition from Phase 1 to Phase 2 would exert great perturbation in the stability of the RCP, which gives rise to a critical incident (scoring or losing a point), as the transformation of tactics (from restricting the opponent’s attack to attacking actively) and techniques in use (from service and control techniques to attack techniques) would result in the sudden conversion of the placement (typically from short or half long to long), velocity (from comparatively lower to higher) and spin (from non-topspin to topspin) of the ball.
The RCP ceasing in Phase 3 accounted for approximately one third of the sampled rallies. Phase 3 is the continuation of the RCP after the first topspin exchange (Phase 2), where the RCP enters the stage of both players executing mainly simplified tactics, attacking one another with drive or topspin strokes (Zhang et al., 2018). The RCP ceasing in Phase 1 occurred seldom in elite men’s singles matches, for the primary tactical intention of the offensive style player is to seek opportunities as early as possible to use attack techniques to score. Furthermore, it is difficult for players to successively execute control strokes, which could effectively restrict the opponent’s attack in the fast control stroke exchange.
RCP ceasing in Phase 1
The results showed that the server could score a greater proportion of points after the RCP started with a successful service and without entering Phase 2. This is due to the superiority of the service among all types of techniques. The server could implement service strategies totally in line with his tactical intentions. On the other hand, for the receiver, it is quite challenging to make accurate judgment and execute an effective control stroke simultaneously when dealing with the incoming ball with a variety of possibilities of non-topspin (sidespin, backspin, sidespin in addition to topspin or backspin) and landing location. However, as the probability of the RCP ceasing in Phase 1 was low (7.1%), it played a minor role in determining performance for elite men’s singles matches.
RCP ceasing in Phase 2
A1, representing the RCP with the receiver launching an initial attack while receiving, was the most occurring IP1-2. This is due to the substantially increased use of the flip in contemporary matches when dealing with a short service (Wang, 2019), as well as the employment of an unhidden service and the change of match balls, for the purpose of reaching competitive balance between the server and the receiver (Zheng et al., 2018). A2 was the second most frequently occurring IP1-2, equal to the conventional “service and attack” strategy of the server. A3 and A4, representing the RCP with both sides unable to launch an initial attack in the first three shots, were less likely occurring IP1-2. In general, the results were similar across all four types of IP1-2. On the one hand, the initial attacker lost larger proportion of points by a direct initial attack fault than a winner. On the other hand, the counter attacker was induced to commit a greater proportion of a counterattacking or a defensive error than scoring a point.
Comparing the two patterns of the RCP2 with the receiver launching an initial attack, the frequency of the receiver committing a direct initial attack error decreased (from 88.0% to 73.8%), and the ratios of forcing the server to commit a counterattacking error (from 51.3% to 55.3%) and a defensive error (from 79.7% to 88.0%) increased when using A3 than A1. This is probably due to the change of condition for the receiver to employ the initial attack. When launching the initial attack while receiving, the results are affected by the everchanging service strategy. However, it is easier for the receiver to initiate an attack after the impact of the service is neutralized by exchanging control strokes. As for the RCP2 with the server initiating an attack (A2 and A4), the outcomes were quite similar, which indicated that the effect of the server’s initial attack did not fluctuate with the change of patterns.
Phase 2 produced almost two thirds of the rally outcome, which was the decisive phase for matches between elite male players. The results displayed that regardless of IP1-2, the probability of scoring a point in Phase 2 for the initial attacker after a successful initial attack was higher than for the counter attacker. However, no matter which side initiated the attack under any IP1-2, players also suffered a great deal of direct errors. This reminds players that exerting perturbation in the RCP first to gain the upper hand should be based on stability, especially for the receiver.
RCP ceasing in Phase 3
As the antecedent actions for the RCP ceasing in Phase 3, IP1-2 serves as the mode which drives the RCP into topspin strokes competition. IP2-3 reflects the way that the counter attacker responds to the perturbation brought by the initial attacker. A1 was still the most frequent pattern adopted, whereas A4 was the least. For the RCP3 with the receiver conducting the initial attack, by both A1 and A3, the probability of the receiver scoring when the server used a defensive technique in Phase 2 (B2) was higher than when the server employed a counterattack (B1) for the RCP3 finishing both in the first exchange (c1) and after several exchanges (c2) in Phase 3. However, there was no significant relationship between the rally outcome and the RCP3 beginning with the server launching the initial attack (A2 and A4).
It is logical that establishing advantage in Phase 2 (forcing an opponent to defense) could increase the possibility of scoring in Phase 3. However, data showed that only the receiver could better seize the opportunity to score more under such condition than entering Phase 3 in equilibrium (server counterattacks in Phase 2). Moreover, the ratios of the receiver scoring a point within the first exchange of Phase 3 were higher than by several exchanges for the RCP3 beginning with A1 and A3. On the contrary, for the RCP3 with the server launching the initial attack, the probability of the server scoring within the first exchange of Phase 3 was lower than that by several exchanges. These results together indicated that the receiver was better at producing scores by creating perturbation with the initial attack and executing a killer shot on the following stroke (the first stroke of Phase 3).
Although the influence of the service and the following attack would be reduced with an increasing number of shots (Gómez et al., 2017; Tamaki et al., 2017), the results suggested that, whether being a server or a receiver, to actively drive the RCP into the topspin exchange in Phase 2 would obtain a positive momentum and result in a higher probability of scoring in Phase 3. This provides clues that the impact of the initial attack would, to some degree and in some ways, extend to affect the outcome of Phase 3, which is beneficial to the initial attacker.
The current Interactive Three-Phase Structure follows the phase division method adopted by the traditional three-phase structure and its derived structures to analyze systematically performance according to the technical and tactical abilities to score at different stages of a rally. The advantages of the Interactive Three-Phase Structure comparing to the former ones are as follows. Firstly, performance variables describe bilateral actions in the whole rally competing process rather than merely covering the actions of the targeted player, which offers more comprehensive information to enhance the effectiveness of performance analysis. Secondly, the proposed structure divides a rally competing process into phases in accordance with the shift of tactical intentions and technical employment rather than the shot number, which is better adaptable to the real match situations where players’ behaviors are constantly changing due to interaction. Thirdly, the current structure emphasizes Phase 2 (the initial attack and counterattack phase), as the key phase of the rally competing process that is crucial for determining performance, which makes the analysis more focused.
There is one limitation for the current structure. It is not suitable to analyze matches between an attack style player and a defensive style player (chopper) or between two defensive style players, as the competing features are different. Although it is rare to encounter defensive style players who are able to compete at the elite level, especially for male players, an appropriate performance analysis structure in such a situation would be also needed.
For practical application of this structure, practitioners could use it to conduct both real time and post-match performance analysis to firstly identify the key variables causing performance difference, and then review each targeted variable by analyzing details (stroke technique, ball placement, route of the ball, etc.) to get a better comprehension on the operational level to assist follow-up training and competing strategies.
From the academic perspective, future research should be conducted on the basis of the current analytical structure and then explore: (a) a wider range of high level men’s singles competitions (Olympic Games, World Championships, Would Cups) across a certain length of timeline, especially before and after a significant change of rules or equipment, to get a clear picture of the evolvement of the competing characters; (b) elite women’s singles matches of important international competitions to discover the competing features representing female players.
Conclusions
An Interactive Three-Phase Structure for table tennis performance analysis was proposed in this study. The current structure models a rally competing process into three successive and interactive phases. The advantages of the proposed structure are: first, performance variables are comprehensive containing bilateral actions covering the whole rally competing process; second, the method of phase division is better at reflecting real match situations; and third, the designed critical phase makes analysis more focused. The application to the elite men’s singles matches produced the results of the competing characters of table tennis competitions of the world’s highest level. The findings displayed that the variables of the rally competing process ceasing in Phase 2 were crucial for determining performance. Overall, the proposed structure provides a better tool for practitioners to conduct table tennis performance analysis.