Introduction
Resistance training (RT) is recommended as part of a regular exercise routine and lifestyle modifications to prevent cardiovascular risks and control blood pressure (Pescatello et al., 2004) as well as hypertension (Jackson et al., 2008). Studies on healthy populations have discovered improvements in vagal control of the heart and relative blood pressure (BP) reduction (Collier et al., 2009). A slight decrease in BP (i.e., 3 mmHg) reduces the risk of stroke and coronary artery disease in hypertensive and normotensive subjects. Thus, RT can be a useful tool for changing BP. Some of the attributes to BP reduction after a RT session include central mechanisms, such as resetting of arterial baroreceptors, sympathetic nervous system (SNS) and the parasympathetic nervous system (PNS) activation, and vasodilation after RT as a result of active and reactive hyperemia (Figueiredo et al., 2015; Kraemer et al., 1991; Kraemer and Ratamess, 2004; Abdi et al. 2019).
The underlying mechanism for BP changes after RT is the stimulation of the autonomic nervous system. The autonomic nervous system, which consists of parasympathetic and sympathetic divisions, is responsible for monitoring blood vessel pressure, vassal dilation, and constriction, together with the heart’s contraction ability. After exercise, BP can be influenced by both SNS and PNS. Both the PNS and SNS regulate HR changes by constantly sending signals to the sinoatrial node (Marieb and Hoehn, 2007). Excitatory signals sent through the thoracic region of the spinal cord and inhibitory signals sent through the vagus nerves cause the heart to exhibit a change in vagal tone (Marieb and Mallatt, 2002). The autonomic nervous system reactions are measured via heart rate variability (HRV) (Sztajzel, 2004). Moreover, HRV has been suggested to be an important indicator of mortality (Kors et al., 2007). Studies on HRV have revealed that coronary heart disease and mortality could be predicted by the variation in HR intervals, with lower HRV indicating greater risk (Aune et al., 2017).
Resistance training variables such as rest intervals (RIs) between sets, volume of training, load, and the number of sets can be manipulated to fulfill training objectives. RT reduces HRV when applied in different volumes (Costa e Silva et al., 2016; Farinatti et al., 2011), flexibility levels (Weymann et al., 2004), breathing patterns (Farinatti et al., 2011), total sets volume (Inami et al., 2015), and with different stretching techniques (da Silva Araujo et al., 2019). In addition, previous studies have controlled RT variables and attempted to identify possible differences in hemodynamic responses after RT by modifying the exercise order (Figueiredo et al., 2013; Kingsley and Figueroa 2016), load intensity (Figueiredo et al., 2015; Kingsley and Figueroa 2016) and total sets volume (Figueiredo et al., 2015). Nonetheless, limited studies have compared the effect of different RIs between sets on post-exercise BP changes in physically active men. RIs required after exercise and between sets can affect hormonal (Maresh and Fry, 1991) and cardiovascular (Häkkukinen et al., 1985) responses to an acute session of RT, training adaptation and performance of subsequent sets (Kraemer and Ratamess, 2004). It has been reported that RT performance may be influenced differently with short (1 min) or long (3 min) RIs (Kraemer and Ratamess, 2004). It has also been suggested that RIs should range from 30 s up to 3 min depending on the objective of the exercise or the training intensity (De Salles et al., 2010; Kraemer and Ratamess, 2004). However, the data are unclear regarding which RIs can optimize HRV and BP changes to minimize cardiac autonomic modulation and BP after RT.
Based on this discussion, HRV analysis can deliver important information about the function of the SNS and PNS during rest and activity (Xhyheri et al., 2012). However, few studies have investigated the effect of RT on HRV (Figueiredo et al., 2015, 2016; Heffernan et al., 2007), and there is no evidence comparing the effect of different RIs between sets of RT on HRV and BP changes. This research plays an important role in identifying the effects of RT on BP and HRV and can help exercise professionals prescribe the appropriate RIs for healthy populations. Therefore, the purpose of this study was to compare the effect of different RIs between sets (1, 2 and 3min) in a RT session on BP and HRV changes in physically active male participants. It was hypothesized that shorter RIs during RT would have a longer effect on BP and HRV changes.
Methods
Procedures
The present study used a single group repeated measure design, with three within participant conditions to examine the effect of different RIs on BP and HRV (Figure 1). During the study, participants were required to attend six laboratory sessions during an 18-day period with at least 48 h in between. The first session was the familiarization session with the purpose to familiarize participants with the exercises to be performed during the experiment and testing. After 48 h, participants underwent 15RM testing and retesting with a rest period of at least 48h between each testing session. Following a RT session, there is a decrease in the function of the neuromuscular and autonomic nervous system that can be restored or increased above baseline value after 48 h (Chen et al., 2011; Kassiano et al., 2021). The testing session comprised four exercises, namely squatting (SQ), bench press (BEP), barbell bent-over row (BR), and deadlift (DL).
Figure 1
Experimental design SQ=squat; BEP=bench press; BR=bent-over-row; DL=Deadlift; GrpS=short rest interval group (1min); GrpM=Moderate rest interval group (2min); GrpL=long rest interval group (3min)
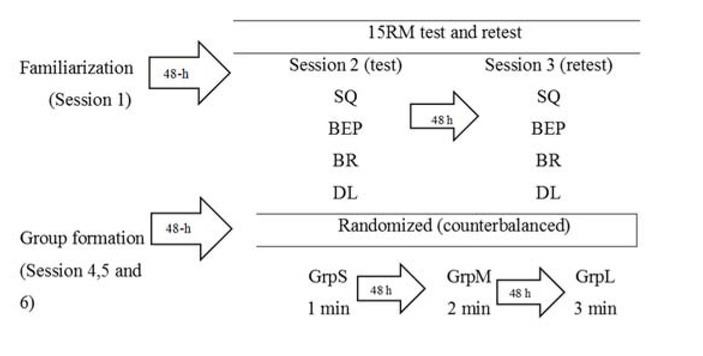
Seventy-two hours after the retesting session, all participants completed three acute experimental training sessions in randomized counterbalanced order that included: (a) RT with 1min RIs between sets (GrpS), (b) RT with 2min RIs between sets (GrpM), and (c) RT with 3min RIs between sets (GrpL). Each experimental training session was conducted on three separate days with a rest period of at least 48h in between. During the experimental training sessions, participants performed three sets of the SQ, BEP, BR, and DL in sequential order, using the designated RI between sets with a 15RM load as this load has been reported to be a suitable load to reduce BP and HRV in physically active men (Alemi et al., 2020).
Participants
An a priori power analysis (G*power) was performed with the power set at 0.80, α=0.05 and effect size=0.35; this analysis determined that a total of 18 participants (21.2 1.1 years old, 175.3±7.1 cm, 76.5±5.8 kg and 11.8±3.5 months of RT experience) was adequate. The inclusion criteria were as follows: male participants with no cardiovascular diseases, physical injuries or acute illnesses, the minimum of 180 min of physical activity per week according to the physical activity recommendations of the ACSM (American College of Sports Medicine, 2013). Additional inclusion criteria were that participants did not take any medication nor smoked six months prior to the study. Participants refrained from strenuous physical activity, consuming alcohol, tobacco, medications, or dietary supplements 48hr prior to testing sessions and during the study period. They maintained their dietary habits. No participants dropped out of this study. Furthermore, the ethical committee for research involving human subjects of the University approved of this research. All participants were informed of the potential benefits and risks of the investigation and signed an informed consent form prior to the commencement of the study.
Measures
Fifteen Repetition Maximum
The participants’ 15RM load was determined using the method described by ACSM (American College of Sports Medicine, 2013). Initially, participants performed a brief warm-up consisting of 15 repetitions with a very small self-suggested load (approximately 50% of the normal RT load). Subsequently, the 15RM test was performed with 15min rest intervals between exercises. The test and retest sessions were conducted on two separate days with a minimum of 48h in between. The initial load for 15RM testing was determined according to the load generally used by each participant in a RT session. The main purpose of 15RM testing was to determine the highest load that a participant could perform for 15 consecutive repetitions with full range of motion and no pause between the concentric and eccentric phases of the movement. The exercises for 15RM testing were performed in the following order: SQ, BEP, BR, and DL. In the event a participant failed to do so, the load was adjusted accordingly, and an appropriate rest period was given until he could successfully perform 15 consecutive repetitions subject to a maximum of 3 to 5 attempts per test. Rest intervals of 3–5min were provided between attempts. All exercises were performed using free weights, and the mass of all weights and barbells used was confirmed using a precision scale (Column Scale Model No. 769, Seca, Germany).
Resistance Training
RT exercises were performed in three sets to failure at the 15RM load and in the same order as 15RM testing. All RT sessions were preceded by a 10 min warm-up, beginning with a slow jog to raise the body temperature, followed by performing light loads of each exercise (10–20% of the 5RM load) for 15–20 repetitions. For each experimental training session, participants performed maximal repetitions to concentric failure while the number of successful repetitions completed was recorded after each set and during the sessions. No pause was permitted between concentric and eccentric phases of each repetition, and velocity was volitionally controlled. Systolic blood pressure (SBP), diastolic blood pressure (DBP) and HRV (HF and LF) were measured after a 10min passive rest period was enforced upon arrival at the laboratory and for 120 min post-exercise at 15 min intervals.
Heart Rate Variability Measurements
During the test and training sessions, participants reported to the laboratory between 6 and 11am. Subsequently, participants were asked to remain seated with their palms facing skyward in a quiet room with a temperature maintained between 21 and 23⍛C while HRV data were collected from each of them. To obtain more accurate and precise HRV data, this study adopted metronome breathing technique to minimize the respiratory effect on autonomic modulation. The breathing of participants was set at 12 breaths per minute guided by a metronome.
In this study, HRV data were recorded using a portable HR monitor (Polar Team S810i, Kempele, Finland) with a storage capacity of 30,000 R-R intervals and accuracy of 1 ms against an ECG system for 20min continuously. The portable HR monitor was positioned on the distal third of the sternum of participants to record their HRV. The HRV data were subsequently downloaded on the computer for further analysis.
HRV variables were calculated based on the R-R intervals, which were obtained at a sampling frequency of 500Hz, and the two components. The Kubios HRV Analysis Software (version 2) program, which applies the Fourier transformation with reduced noise filtering, was used to split the R-R intervals into the time and frequency domain. The spectral analysis in the frequency domain was performed by the Fast Fourier algorithm. For HRV analysis in the frequency domain, we utilized the spectral component of high frequency (HF:0.15–0.4Hz) and low frequency (LF:0.04–0.15Hz), in normalized units. The HF in a normalized unit was used as an indication of the parasympathetic outflow, whereas LF in a normalized unit was used as the sympathetic outflow. The normalized unit was calculated by dividing the power of a component by the total power minus the very low frequency power (Tarvainen et al., 2014).
Blood Pressure Measurements
Procedures for BP measurements in this study were executed according to the recommendations of the European Society of Hypertension (Guidelines Committee, 2003). A digital sphygmomanometer (SunTech Medical Oscar 2, Morrisville, NC, USA) with accuracy of nearly 2mmHg of the reference sphygmomanometers was used to obtain the SBP and DBP data (Muecke et al., 2010). Prior to BP measurement, participants were required to remain seated for 10min. Thereafter, BP was measured with participants seated in an upright position in a comfortable and quiet environment to stabilize their BP while their right arm resting on a surface at the heart level.
Intra-subject reliability was assessed to ensure reliability (Jackson et al., 2008). For each participant, BP data were averaged over two consecutive measurements, with participants seated and resting for 5min between measurements.
Statistical Analysis
The reliability of the 15RM test was determined using intraclass correlation coefficients. The statistical analysis was initially performed using the Shapiro–Wilk normality test and the homoscedasticity test (Bartlett criterion). All variables presented normal distribution and homoscedasticity. Data for all variables are displayed as the means±SD. A two-way repeated measures ANOVA (time [Pre vs. Post-15min vs. 30min vs. 45min vs. 60min vs. 75min vs. 90min vs. 105min vs. 120min) × RI groups [GrpS vs. GrpM vs. GrpL]) was used to examine HRV (LF and HF) and BP (SBP and DBP) measurements (SPSS version 22.0, IBM. USA). Statistically significant interactions and main effects were further examined for differences using the Bonferroni assessment. The level of significance for all measured variables was set at p<0.05. Additionally, the magnitude of the findings (the difference between pre- and post-test scores divided by the pre-test SD) was verified through effect sizes (ESs – Hedge) and the results were classified as <0.2 trivial; 0.2 - 0.6 small; 0.6 - 1.2 moderate; 1.2 - 2.0 large; 2.0 - 4 very large; and >4.0 near perfect (Rhea, 2004). Total training volume (repetition × load) was computed for each RT group. One-way repeated measures ANOVA was used to compare the total training volume between RT groups.
Results
For the 15RM test and retest, the intraclass correlation coefficient for each exercise was SQ=0.89; BEP=0.95; BR=0.92; DL=0.91. No statistically significant differences between the three RT groups were detected for total training volume. Table 1 shows the means (SD) and f and p values for each of the variables.
Table 1
Mean and standard deviation (±SD) of training volume of each group
Blood Pressure Results
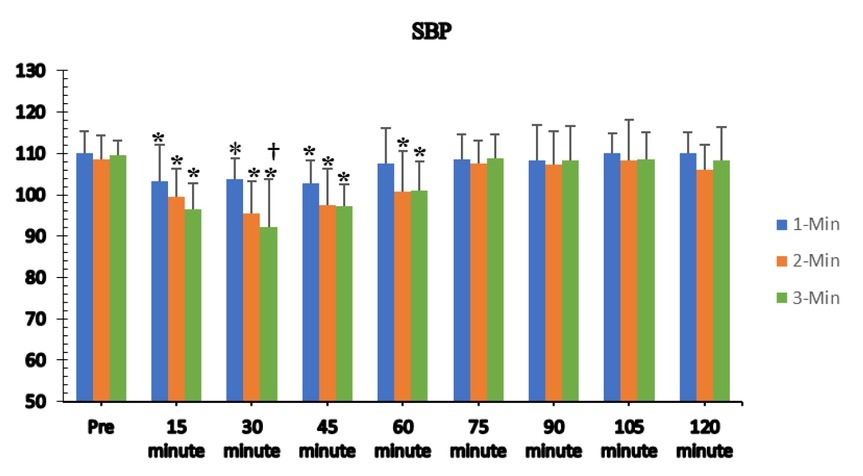
The Mauchly’s test of sphericity indicated that the assumption of sphericity was violated for the two-way interaction (χ2(2)=83.23, p>0.05), and the F-ratio was obtained using the Greenhouse-Geisser epsilon (0.187). There was a statistically significant interaction between the RIs and time for SBP changes [F(2.99,50.82)=3.08, p=0.036], and a significant reduction in SBP was found at the 15th, 30th, 45th and 60thmin post-exercise time points for the GrpM and GrpL compared with the pre-exercise scores. However, in the GrpS, the SBP reduction only lasted until the 45thmin time point after exercise (Figure 2). The SBP reduction was significantly greater in the GrpL (M=10.66, SE=3.73mmHg, p=0.033) compared with the GrpS at the 30thmin post-exercise recovery time point.
Figure 2
Systolic blood pressure responses to different rest intervals (mean ± SD).
*Significant difference from pre-test (p < 0.05);
† Significant differences between rest intervals (p < 0.05)
The analysis for DBP was similar to that of SBP; the assumption of sphericity was not met (χ2(2)=81.97, p>0.05), and the degrees of freedom as calculated with the Greenhouse-Geisser epsilon were also similar (0.255). There was a statistically significant interaction between the RIs and time for DBP changes [F(4.07,69.23)=4.83, p=0.02]. However, unlike SBP, significant reductions in DBP were found after training that lasted up to the 30thmin time point in the GrpS, the 45thmin time point in the GrpM and the 60thmin time point in the GrpL compared with pre-exercise measures. Figure 3 shows that DBP was significantly lower in the GrpL at the 45thmin time point (M=10.44, SE=2.37 mmHg, p=0.001) compared with the GrpS and at the 60thmin time point compared with the GrpM (M=8.44, SE=3.3 mmHg, p=0.006) and the GrpS (M=8.00, SE=1.84 mmHg, p=0.001). Table 2 shows SBP ESs after RT sessions for the GrpS, GrpM, and GrpL. SBP and DBP for all groups showed moderate ES values, except SBP at the 30thmin time point and DBP at the 15th, 30th and 45thmin time points in the GrpL.
Figure 3
Diastolic blood pressure responses to different rest intervals (mean ± SD).
*Significant difference from pre-test (p<0.05); † Significant differences between rest intervals (p<0.05)
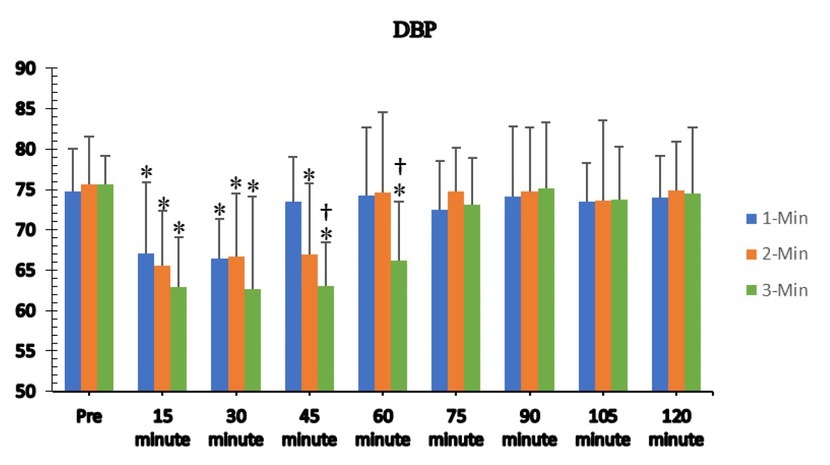
Table 2
Systolic and diastolic blood pressure effect size responses to the resistance training sessions
Heart Rate Variability Results
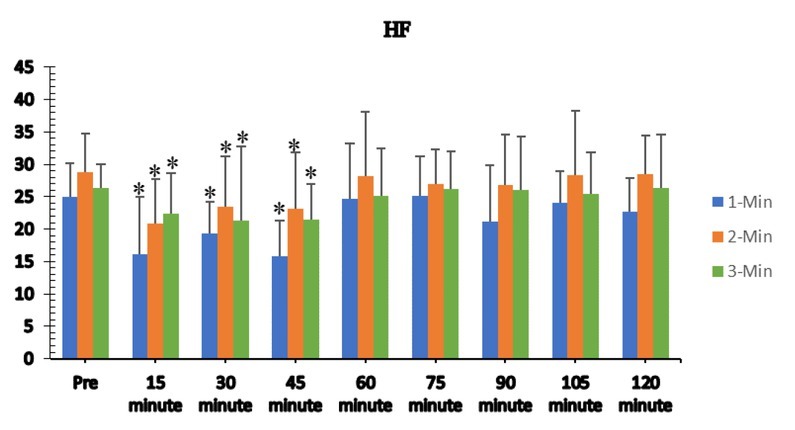
The HF analysis showed that the Mauchly’s test was significant and indicated that the assumption of sphericity had been violated (p=0.011). Thus, the F-ratio was obtained using the Greenhouse-Geisser epsilon (0.322). Nevertheless, there was no significant interaction between RIs and time for HF fluctuations (p>0.05). The main effect of time showed a statistically significant difference in mean HF fluctuations at the different time points [F(3.12,53.11)=15.67, p<0.05] (Figure 4). The post hoc analysis found a significant reduction in HF at the 15th, 30th and 45thmin time points for all three groups compared with the pre-exercise scores. The ES showed a greater magnitude of HF reduction at the 15th, 30th and 45thmin time points with a greater decrease in the GrpS and GrpM (Table 2).
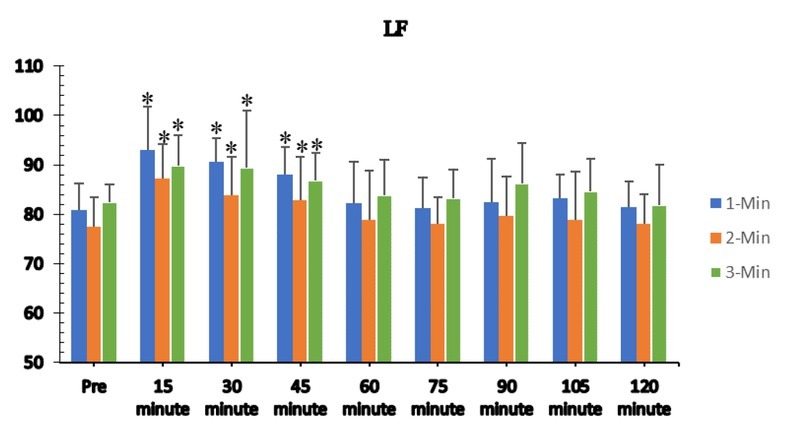
Figure 4
High frequency responses to different rest intervals (mean±SD). *Significant difference from pre-test (p<0.05)
Similarly, for the HF analysis, the Mauchly’s test was also significant, and the assumption of sphericity was violated (Greenhouse-Geisser epsilon=0.285). No significant interaction was found between load intensity and time on LF fluctuations (p>0.05). A significant [F(3.31,56.34)=31.54, p<0.001] main effect was found between different time points with the post hoc analysis showing a significant increase in LF at 15th, 30th and 45thmin time points for all three groups compared with the pre-test results (Figure 5). The ES of HF had a greater elevation at the 45thmin time point in the GrpS and GrpM compared with the GrpL (Table 2).
Discussion
The purpose of this study was to examine the effect of three different RIs between sets on BP and HRV changes after RT in physically active men. The key findings of this study indicate that post-exercise SBP and DBP reductions after an acute RT session with both 2 and 3min RIs lasted longer than after exercise with a 1min RI. Furthermore, HRV changes were also superior with moderate (2min) and longer (3min) RIs, but the effects lasted for shorter duration compared with the BP reduction after exercise.
Blood Pressure Changes
The results showed that a single bout of RT with short (1min), moderate (2min) and long (3min) RIs between sets decreased SBP and DBP for up to 60 min post-exercise. However, the reduction in SBP and DBP was greater after training with RIs of 2 and 3min. Although the effect of length vs. intensity of training on the BP reduction has been a controversial topic (Alemi et al., 2020; Costa e Silva et al., 2016; Farinatti et al., 2011; Figueiredo et al., 2013; Kingsley and Figueroa 2016), the results of this study indicate that a longer RI may cause longer duration and consequently a longer time of exposure to the RT stimulus and higher magnitude of the post-exercise BP reduction compared with short RIs between sets of RT, which may result in a higher training density. Thus, the extent of the BP reduction was greater with longer RIs. These findings are consistent with those of Figueiredo et al. (2016) who recruited prehypertensive men with 6 months of RT experience to perform RT with 1 and 2min RIs between sets of exercise. Figueiredo et al. (2016) reported a significant difference in SBP reduction after RT training sessions compared with pre-test values with longer RI duration and no difference in SBP changes between RIs after RT sessions. In this study, RT protocols involved short, moderate, and long RIs performed to concentric failure. This type of a RT protocol mostly relies on the fast-glycolytic energy pathway; thus, the longer RIs likely brought progressively higher acidity in the active musculature over the course of multiple sets (Golas et al., 2019; Kassiano et al., 2021; Kingsley and Figueroa, 2016). Several BP mechanisms related to the activation of mechanoreceptors and chemoreceptors were activated (Kraemer et al., 1991; Kraemer and Ratamess, 2004).
The results were partially consistent with a study that examined the effect of two different RIs (i.e., 1 vs. 2min) between sets of RT in older normotensive trained man (De Salles et al., 2010). De Salles et al. (2010) stated that both RIs promoted BP changes with similar magnitude for SBP (21.8mmHg) and DBP (13.3mmHg); however, changes in DBP persisted for a longer extent after the 2 vs. 1min rest protocol (60 vs. 50min). Another study by Velso et al. (2010) reported significant reductions in DBP (i.e., 2.5mmHg) after RT sessions performed at a high intensity (i.e., 80% of 1RM), regardless of whether 1, 2 or 3min RIs were introduced between sets and exercises in untrained participants. However, compared with controls, all protocols resulted in significantly lower values (i.e., 5–7.9mmHg). Thus, the training status of the sample (trained or untrained), differences in the RI used (1, 2 or 3min) and the sample’s age (young or old) seem to influence the duration of the BP reduction after a RT session (Kingsley and Figueroa, 2016).
HRV Changes
HRV is an indicator of the synchronization between the cardiovascular system and the autonomous nervous system. Current evidence suggests that increased HRV is important for reducing risks in both healthy individuals and patients with heart-related disorders (Grässler et al., 2021). Of the two HRV variables, LF levels and how long the levels are prolonged are indicators reflecting the SNS, whereas HF levels give similar information regarding the PNS. The results from this study show that HF and LF were influenced for up to 45 min by RT when performed with short, moderate, and high RIs between sets. The ES shows that the magnitude of HF changes was smaller 45 min post-exercise in the GrpL, and the magnitude of LF reversion to pre-exercise conditions was smaller in the GrpM. However, adequate sympathetic and parasympathetic systems’ activation with 2 and 3min RIs may have resulted in SBP and DBP reductions in the GrpM and GrpL. Only one previous study has examined the effect of two different RIs (1 vs. 2 min) between sets of RT on HRV (Figueiredo et al., 2016). Although there was a significant change in HF at 10min post-exercise for the 1 min RI group, Figueiredo et al. (2016) did not find any significant differences in LF changes after performing three sets of RT with 70% 1RM. There were no differences in HRV between the two exercise protocols. One possible explanation for these findings could be the similarity in the degree of vagal nervous system activation when RT was performed with different RIs between sets. Therefore, there was no significant difference in HRV changes observed among the different RIs.
Practical Implications
The results of this study have practical implications related to the modification of training variables for RT. Based on the results from a previous study (De Salles et al., 2010), a 2min RI with moderate loads of 10–15RM (Alemi et al., 2020) with more than 200 repetitions (Heffernan et al., 2007) seems to elicit better BP responses that are not detrimental to HRV responses or longer rest duration. Moreover, this study supports the use of 2 and 3min RIs because that length of time seems to increase reversion of parasympathetic activation along with sympathetic activity, which reduces the risk for both healthy individuals and patients with cardiovascular disease (Figueiredo et al., 2016), even with only one session of RT training.
However, previous research did not clearly establish the isolated effect of RIs on cardiac autonomic modulation and BP (Figueiredo et al., 2015, 2016; Heffernan et al., 2007). The results of this study could help outline the effectiveness of post-exercise BP and HRV response after RT sessions performed with appropriate RIs between sets and help individuals concerned with identifying and employing specific RIs between sets of RT or looking for low disturbance of the SNS and PNS to maximize the effect of acute training adaptation on BP and HRV for healthy, physically active men. Further research is certainly necessary to examine other training variables such as exercise order, the number of sets, or the influence of the movement tempo.
It is important to address a number of limitations of the current study when interpreting its results and to consider the position adopted for testing BP and HRV after a RT session. In our study, participants were required to stay seated for 2h after exercise in order to test their BP and HRV. However, the research by Gotshall et al. (1994) suggested that a prolonged seated position may affect HRV changes which can result in venous return and increased baroreflex activity. Optimal positioning for reflecting the autonomic nervous system status of RT also remains to be studied (Flatt et al., 2019; Malheiros et al., 2020). Moreover, the interindividual differences in the movement tempo were not controlled. This can be considered as both a strength and limitation of this research design. The influence of the movement tempo is important, since during this study the first repetitions were executed at a higher tempo (velocity) and when muscle fatigue occurred there was a significant reduction in the movement tempo (Maszczyk et al., 2020). However, the freedom to choose the movement tempo is a better imitation of the real-life training scenarios, therefore, this freedom can enhance the ecological validity.
Conclusions
In conclusion, the main findings of the present study demonstrated that of the three different RIs between sets of RT, the 2 and 3min RIs had longer and greater magnitude of effect on the BP reduction in physically trained men. These findings are applicable for coaches and athletes because RT is frequently recommended as part of exercise programs to prevent high BP. The protocol was shown to be safe and can help with creating RT sessions for healthy male adults. Further studies should be conducted that examine the influence of manipulating different RT variables such as exercise sets on the post-exercise response.